We may earn a commission from links on our site, but this doesn’t affect our reviews. Learn more.
Hedge With Crypto is an independent publisher that provides objective and free content. Articles on our site may include links to our partners. If you click on these links, we may earn a commission. However, our editorial content remains unbiased, reflecting our own opinions or the general information available. For more information on our company policies, read the Affiliate Disclosure, Privacy Policy, and Terms & Conditions.
How To Use Bollinger Bands In Crypto Trading
Bollinger Bands can be a powerful momentum indicator for trading crypto. This tutorial explains how to use Bollinger Bands in the crypto markets.
Hedge With Crypto aims to publish information that is factual and accurate as of the date of publication. For specific information about a cryptocurrency exchange or trading platform please visit that provider’s website. This information is general in nature and is for education purposes only. Hedge With Crypto does not provide financial advice nor does it take into account your personal financial situation. We encourage you to seek financial advice from an independent financial advisor where appropriate and make your own enquiries.
TABLE OF CONTENTS
Technical indicators are perhaps the most common method of analyzing financial market data, providing valuable insight into the price trends of digital currencies. The Bollinger Bands indicator is a particularly useful tool for crypto traders to have around their belt – but what exactly is it, what are its limitations, and how to use Bollinger bands when trading crypto?
Featured Partner
Kraken
Best Exchange To Buy Bitcoin
4.8 out of 5.0
Kraken is a top-rated and regulated exchange best known for its safety and multiple methods to buy Bitcoin and crypto worldwide.
222
USD, GBP, EUR, CAD, CHF, JPY & AUD
Bank transfer, SWIFT, SEPA, debit and credit card
0.16% (maker) and 0.26% (taker)
How To Trade Crypto With The Bollinger Bands Indicator
1. Open the crypto charts
The first step to using any sort of technical analysis strategy is to find crypto charting software. Many modern exchanges have already introduced powerful and customizable charting tools to their trading interfaces. Otherwise, there are several standalone options that are dedicated to providing charting software. One of the best is TradingView, which supports pretty much every financial market you can think of – including thousands of crypto trading pairs. Creating a free account on TV is quick and provides investors access to the Bollinger Bands overlay.
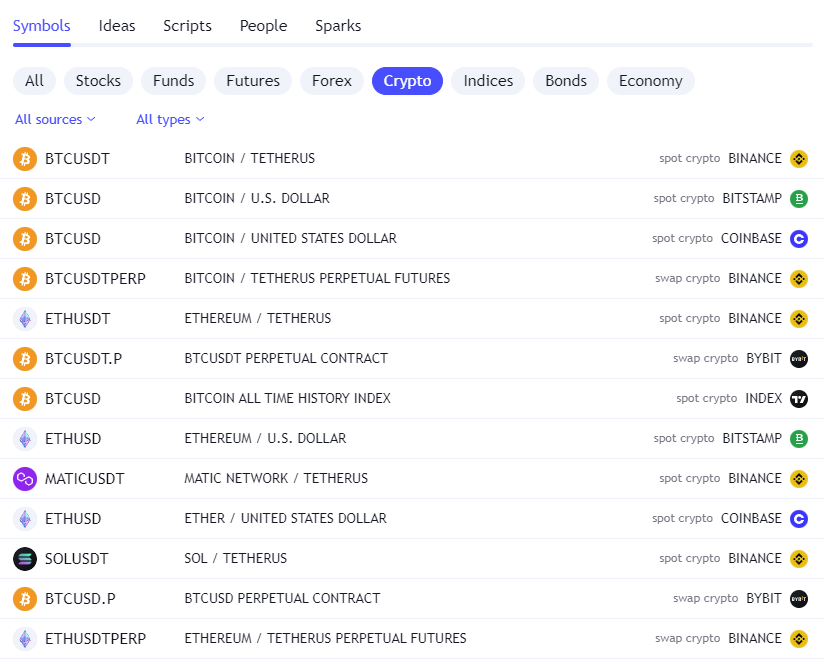
2. Find and select a cryptocurrency trading pair
Charting software will include the option to track the price and volume of thousands of different trading pairs across financial markets. It’s important to select the trading pair best suited to an investor’s trading strategy. For example, if a Bitcoin trader is using Binance to execute their orders, they should look for the trading pair based on the spot price of Binance. This is because each crypto exchange prices its coins differently. Other popular crypto trading pairs include ETH/USD, ETH/BTC, BTC/USDT, and XRP/USD.
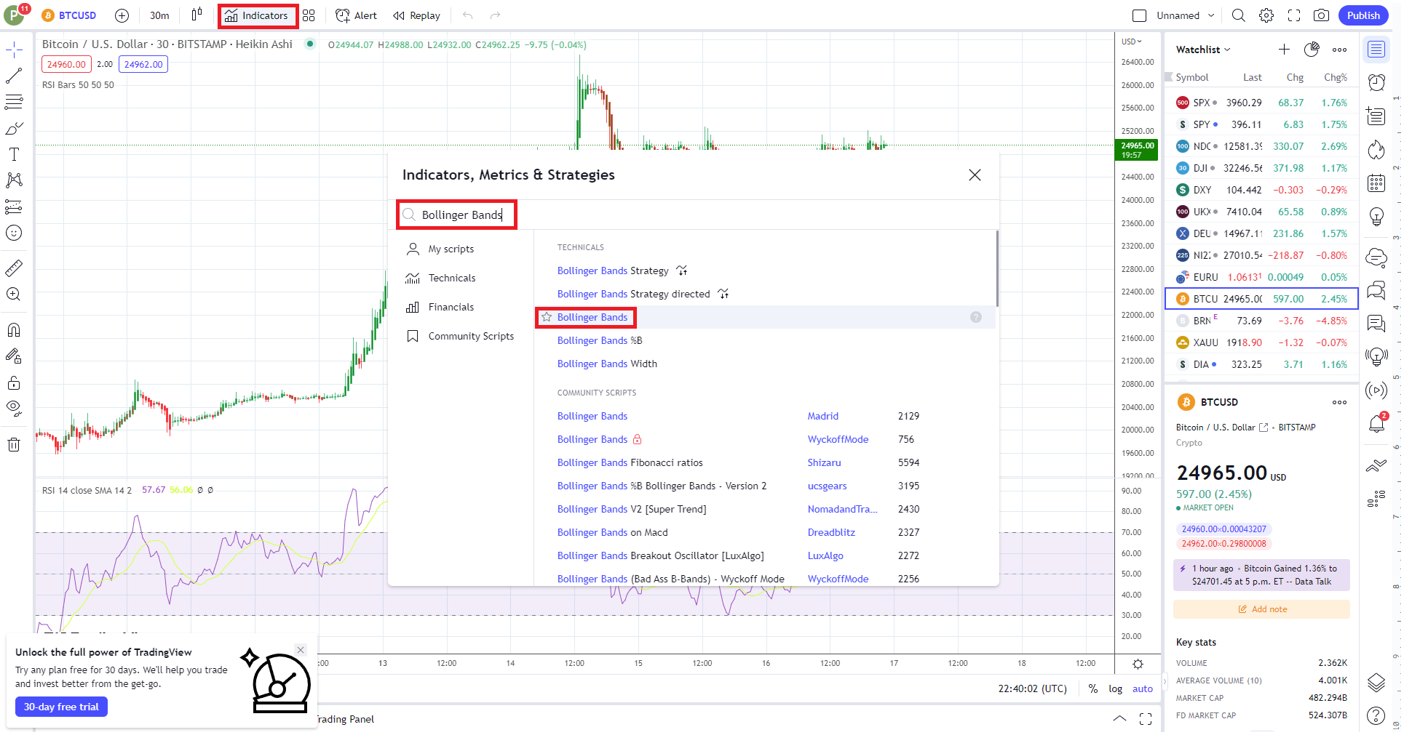
3. Find and add the Bollinger Bands indicator
The next step is to add the Bollinger Bands indicator to the charting interface. Click “Indicators” (which appears above the price chart on TradingView) and begin typing “Bollinger Bands”. Once the correct indicator comes up, click it to add the overlay to the price chart.
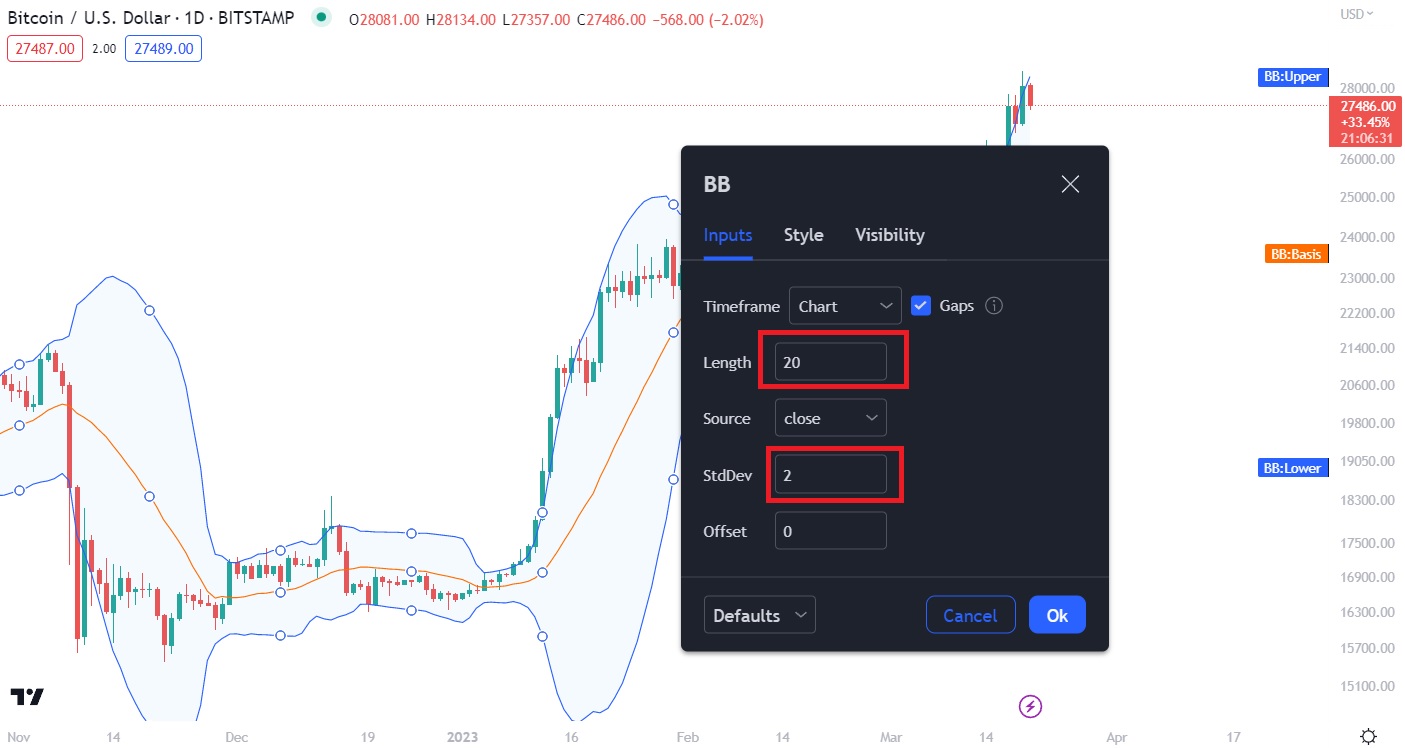
4. Configure the Bollinger Band’s settings
For most investors that are new and learning how to trade cryptocurrency using technical indicators, it’s best to leave the Bollinger Band indicator on its default settings. However, more advanced traders may want to play around with the tool’s settings depending on their strategy. For example, a short-term investor might want to lower the Band’s SMA length to 10-15 (default is 20). Or, a longer-term trader might pump up the standard deviations to 2.5 (default is 2) for more reliable trend signals.
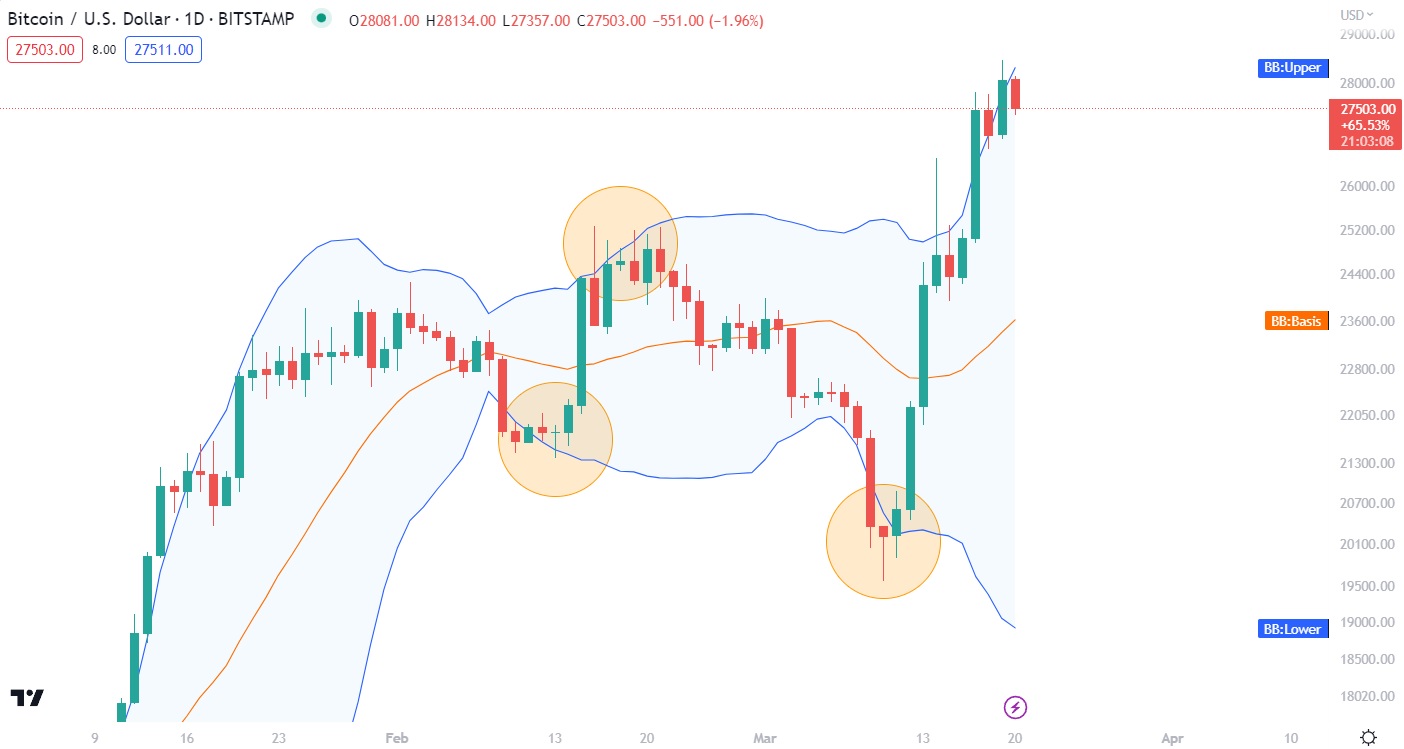
5. Use the Bollinger Band to identify overbought or oversold conditions
Bollinger Bands are a momentum indicator that can be used to identify when a cryptocurrency is entering overbought or oversold territory. The easiest way to implement this is by “riding the bands”. Basically, if the price action on the graph breaks above (overbought) or below (oversold) the upper or lower bands of the indicator can indicate a good time to trade crypto.
6. Confirm the Bollinger Band’s signal
The Bollinger Band indicator can show traders potential entry and exit points for all manner of crypto assets. However, the technical analysis tool is prone to false signals when used in isolation. For example, the price action of Bitcoin might break above the upper band, throwing out a sell signal. But this might just be a minor detour in a strong, long-term upward price trend. Therefore, traders should always use other tools to assess price momentum and look for confirmation signals. Popular pairings include the Relative Strength Index (RSI), Stochastic and MACD indicators.
7. Place orders according to the trading strategy
Once the trade signal has been confirmed by multiple sources, it’s time to execute a trading strategy. Crypto trading platforms such as Binance and ByBit are highly suitable and equipped with the Bollinger band indicator. Investors should always have risk mitigation practices in place to ensure that no one trade can sink their overall plan. Setting up a stop-loss and take-profit order is a great way to minimize losses and keep emotions in check.
What Are Bollinger Bands In Crypto?
Bollinger Bands are a popular momentum crypto indicator built around the concept of perhaps the world’s most-used indicator – the Relative Strength Index (RSI). Like the RSI, Bollinger Bands are primarily used to determine when a crypto asset is overbought or oversold. However, the Bands provide traders with useful information on volatility that is overlaid onto the price chart (unlike the RSI, which uses an adjacent window).
The Bollinger Bands indicator was pioneered in the 80s by the aptly-named John Bollinger. Bollinger developed the tool as an evolution of the RSI – a reliable, easy-to-interpret method of identifying momentum while also calculating volatility.
Bollinger Band Pros:
- Factors in volatility as well as momentum, something other momentum indicators often ignore
- “Riding the bands” is one of the easiest trading strategies for beginners
- Excellent when paired with other simple indicators like the RSI and MACD
Bollinger Band Cons:
- Lagging indicator that can include older, less-relevant price data
- Not as useful when used in isolation
- Better-suited to ranging markets
How Do Bollinger Bands Work?
Bollinger Bands comprise three key components. First, the indicator uses a Simple Moving Average (SMA) which smooths out an asset’s price over a set duration. By default, the SMA is set to 20 periods and is depicted as the middle line in a Bollinger Band setup.
On either side of the SMA, we have two lines. These are the “bands” that give Bollinger Bands its name. These lines are based on standard deviations of the SMA. The band on top of the middle line is known as the upper band and is automatically set to +2 standard deviations of the SMA. Conversely, the band below the middle line is called the lower band and is by default -2 standard deviations of the SMA.
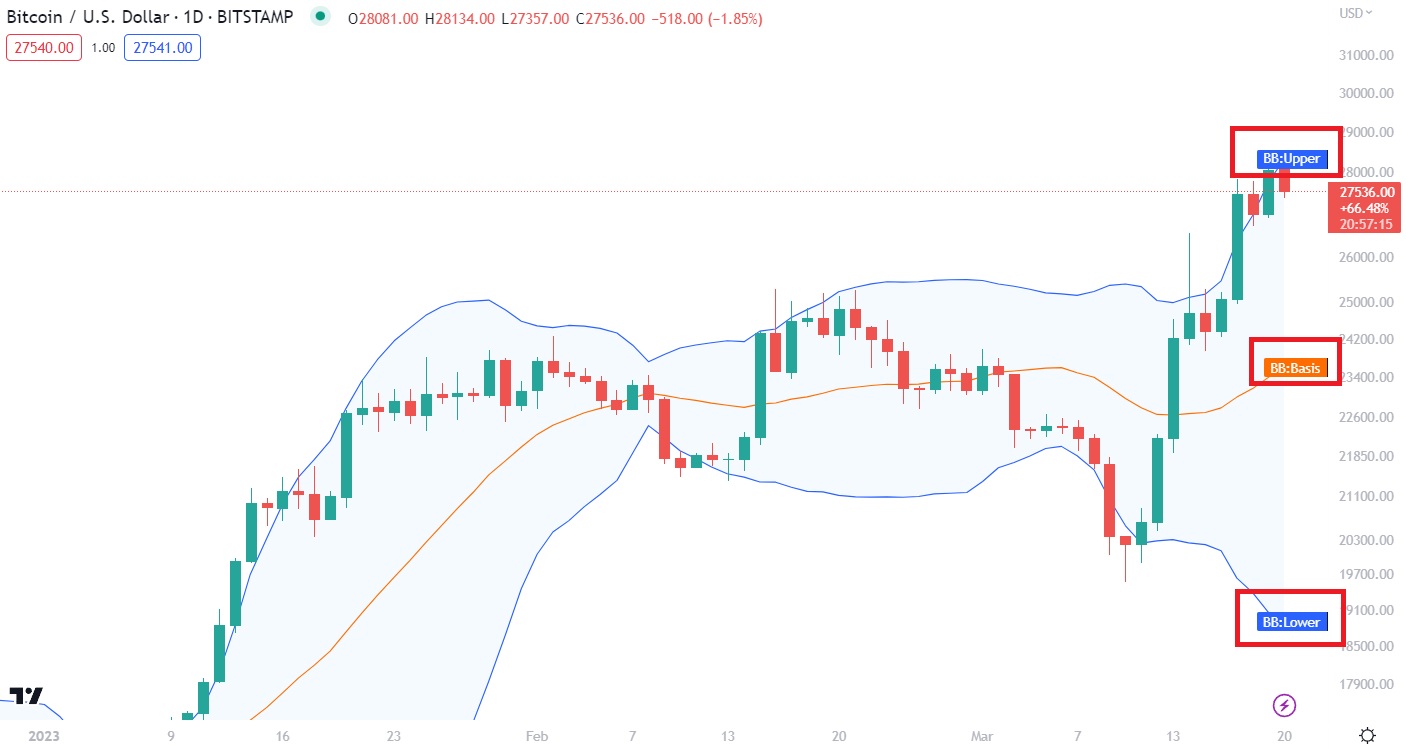
The use of standard deviations in the Bollinger Bands’ formula is to account for and depict volatility. It makes it very easy to see when an crypto’s price is fluctuating rapidly – the gap between the upper and lower band will be quite large. Figuring out standard deviations by hand can be quite complex – so it’s best to let the indicator do the math.
Different Ways To Trade Bollinger Bands In Crypto
“Riding the bands” is by far the most popular and simple strategy for trading with Bollinger Bands. This is a good way to identify short-term shifts in momentum, however, should not be relied upon for longer-term trend readings. Investors can also use Bollinger Band squeezes as a slightly more advanced strategy for trading with the indicator.
Riding the bands
Riding the bands is an extremely simple trading strategy that is actually rather reliable and effective. This is because the vast majority of price action will occur within the bands. This is essentially the premise for the primary Bollinger Bands trading strategy. An asset’s price will typically rebound off the upper band, hit the bottom band, and continue zig-zaging within the Bollinger Band’s range. However, when the price action of a crypto pair breaks through the upper or lower bands, this is considered a soft buy/sell signal.
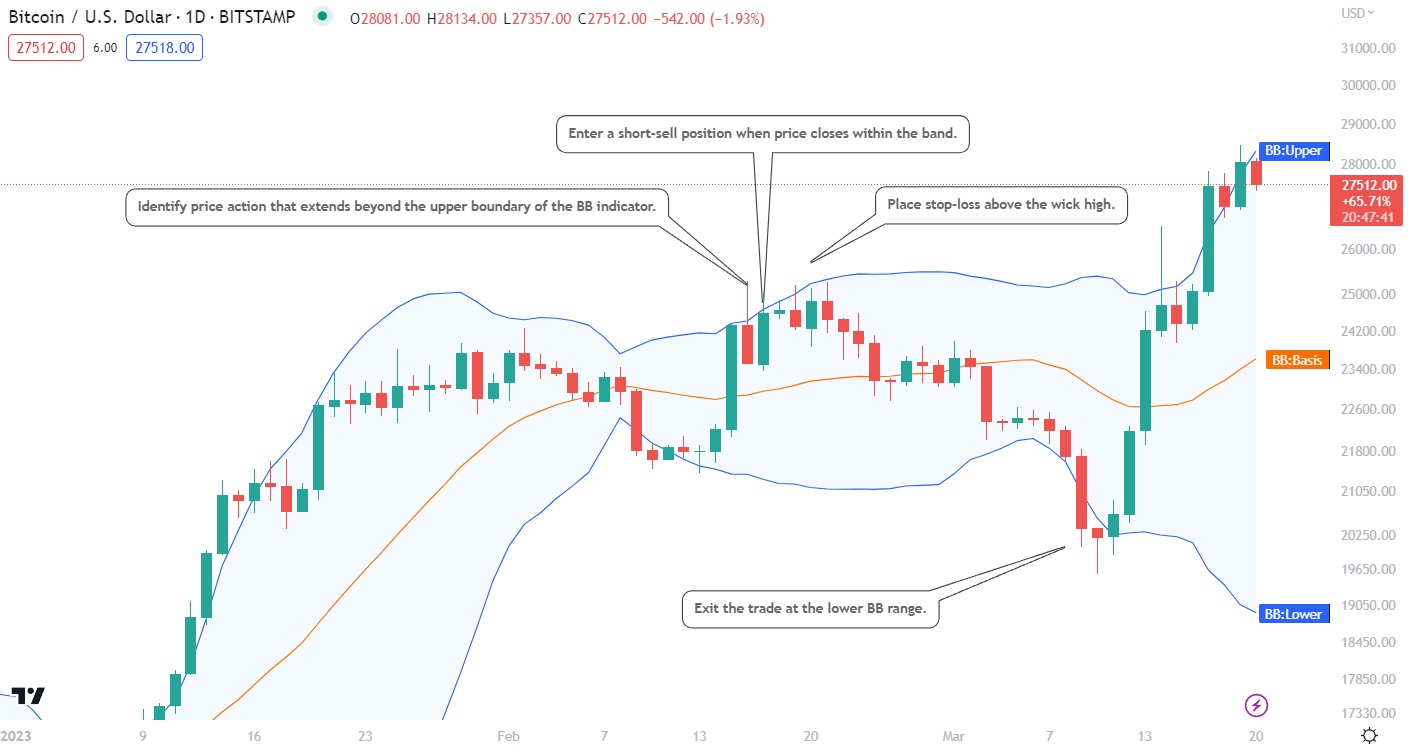
Experienced traders should nearly always wait for confirmation with band breakouts. Let’s say we see the price action of BTC/USD breach the upper band. Ideally, investors will wait out the next two candles to see if their wicks also close above the upper band. If they do, then this is a sell signal that can be confirmed with the RSI or another indicator. If they don’t, however, the trend is weak and entry/exit positions should be reconsidered.
Although signals in all directions can be useful, it’s best for investors to focus on confirming signals that fit within the pre-existing trend. For example, if the price of an asset is trending down, traders should generally ignore buy signals and use any upper band breaches to set a short position (or to sell their holdings).
Riding the bands is more useful in sideways markets. This is because strong price trends can exist entirely within the two bands, meaning investors will never see an entry/exit signal and miss out on a major movement. Band breakouts might correct more often than not in the short-term, but are not typically indicative of any longer-term price trends.
To trade Bollinger bands using this strategy:
- Identify a crypto trading pair and overlay Bollinger bands
- Establish the upper and lower bands for the Bollinger Bands using the preferred settings.
- Monitor and wait for the price to approach the upper or lower Bollinger Bands.
- When the price approaches the upper or lower bands, enter a buy or sell order respectively.
- Place a stop loss order slightly outside the bands.
- Take half profits when the price returns to the middle band.
- Exit the trade and take full profits at the opposing upper or lower band.
Bollinger Band Squeeze
The Bollinger Band squeeze is a trading strategy that capitalizes on another key element of the indicator – volatility. In theory, trading the “squeeze” follows a rather similar concept to riding the bands. In both instances, traders are expecting that when one thing occurs, the opposite is soon to follow.
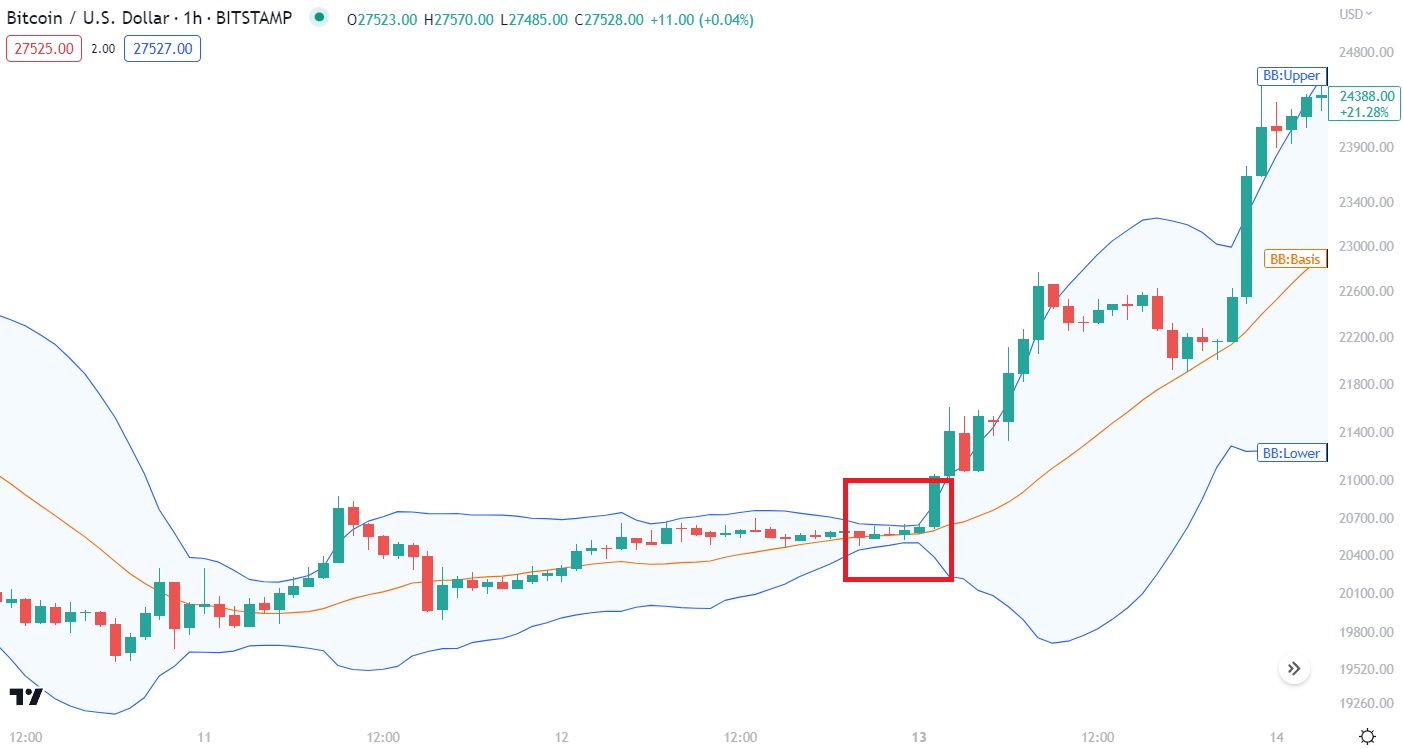
When the upper and lower bands are close together, this is an instance of a squeeze and signals a period of low volatility. During such periods, the price action tends to be quite restricted. However, long periods of a “squeeze” are often shortly followed by a surge in volatility (and quite often, a price breakout). This situation becomes even more likely when trading volume begins to ramp up toward the end of the Bollinger Band squeeze.
Identifying the squeeze on a price chart is incredibly simple, but it provides traders with little information on which direction the breakout will go. That’s why it is best combined with a leading momentum indicator to determine how strong the new trend will be.
To trade Bollinger bands using this strategy:
- Identify a crypto trading pair and overlay Bollinger bands.
- Establish the upper and lower bands for the Bollinger Bands using the preferred settings.
- Monitor and wait for the price to form a squeeze and consolidate near the basis line or 20 SMA for an extended period of time.
- Wait for the price to strongly move away from the SMA line.
- Enter a buy or sell order respectively in the breakout direction.
- Place a stop loss order slightly outside the bands.
- Take profits according to a trading strategy.
Benefits of Using Bollinger Bands In Crypto
- Strategies are easily-interpreted. The two main Bollinger Bands trading strategies – riding the bands and identifying a squeeze – are visually very obvious when analyzing a price chart. This makes it perfect for novices to try their hand at technical analysis without being overwhelmed.
- Measures volatility. Many momentum and trend readings ignore volatility as a major price factor, which is something that the Bollinger Bands indicator addresses. This opens the door for traders to employ strategies like the squeeze.
- Simple settings and formula. Bollinger Bands are calculated using only two real points of data – a Simple Moving Average, and standard deviations based on this. Therefore, there are only two settings that need to be adjusted; the SMA duration and standard deviations. Higher SMA and standard deviation are better for longer-term traders, and the inverse is better for day traders.
Downsides of Using Bollinger Bands In Crypto
- Lagging indicator. Bollinger Bands include old price data (by default from 20 periods ago) which can be less relevant to current trends. This means breakouts identified by the Bollinger Bands indicator may come too slow for traders to maximize their profits.
- Less effective during trending markets. Even major price trends with high volatility (as we see in the crypto markets) can occur entirely within the upper and lower bands of the indicator. This would give investors no obvious trading signals and result in them missing out on potential buy/sell opportunities.
- Unreliable. Like all indicators, signals interpreted from analyzing Bollinger Bands should never be treated as 100% reliable. Potential trading opportunities should always be confirmed through other forms of analysis, like the RSI or Stochastic indicators.
Indicators To Pair With Bollinger Bands
- Relative Strength Index (RSI) – The RSI is a cornerstone in nearly every trader’s toolkit and is one of the most popular technical indicators available. The momentum oscillator can be combined with Bollinger Bands to confirm oversold or overbought conditions. The two indicators form a fantastic pairing as they are both measuring similar things, but use different formulas to arrive there. Therefore, if one indicator contradicts the other, traders can re-think their entry and exit strategy. The RSI can also help demonstrate the strength of a trend.
- Moving Average Convergence Divergence (MACD) – The MACD is another momentum indicator that combines multiple moving averages to analyze current market trends. A basic strategy for pairing the MACD and Bollinger Bands is to look for signal crossovers. If a bearish crossover occurs while the price action is hitting (or breaking) the upper Bollinger Band, this is considered a sell signal.
Frequently Asked Questions
Do Bollinger Bands work for crypto?
Yes, Bollinger Bands are effective for analyzing multiple financial markets, including cryptocurrency. It’s worth noting that most Bollinger Band trading strategies are more useful during ranging markets – so it might be worth considering other forms of analysis during big bull/bear runs.
How do you trade with crypto using Bollinger Bands?
The most popular trading strategy with Bollinger Bands is called riding the bands. This involves exiting a position (or entering a short position) whenever a cryptocurrency’s price action breaks the upper Bollinger Band.
What are the best settings for Bollinger Bands for crypto?
Inexperienced crypto traders should stick to the default settings for Bollinger Bands (20 periods, 2 standard deviations). Day traders might want to consider shortening the settings to 10 periods and 1.5 standard deviations.
Do professional crypto traders use Bollinger Bands?
Yes, even though Bollinger Bands can be incredibly simple to use, they are popular among both professional and amateur crypto traders.
Kevin Groves
Kevin started in the cryptocurrency space in 2016 and began investing in Bitcoin before exclusively trading digital currencies on various brokers, exchanges and trading platforms. He started Hedge With Crypto to publish informative guides about Bitcoin and share his experiences with using a variety of crypto exchanges around the world.