We may earn a commission from links on our site, but this doesn’t affect our reviews. Learn more.
Hedge With Crypto is an independent publisher that provides objective and free content. Articles on our site may include links to our partners. If you click on these links, we may earn a commission. However, our editorial content remains unbiased, reflecting our own opinions or the general information available. For more information on our company policies, read the Affiliate Disclosure, Privacy Policy, and Terms & Conditions.
6 Best Crypto Indicators That Every Trader Should Know
Implementing crypto indicators is an essential skill for traders to have under their belt to identify potential profit-making opportunities. These are the best crypto trading indicators to include in your arsenal.
This information is general in nature and is for educational purposes only. Hedge with Crypto does not provide financial advice nor does it take into account your personal financial situation. We encourage you to seek financial advice from an independent financial advisor where appropriate and make your own enquiries.
TABLE OF CONTENTS
Indicators are a form of technical analysis most often used in conjunction with charting and exchange tools. They can be used to suggest entry and exit points for various assets, flag a shift in market momentum, or follow price trends. This article will list and explain the best crypto indicators for trading based on popularity.
Here's sour shortlist of the best crypto indicators that you can start using:
- Moving averages (best overall indicator)
- MACD (simple reversal indicator)
- Relative Strength Index (good indicator to identify divergences)
- Bollinger Bands (best indicator for swing trading)
- On-Balance Volume (best indicator for trend traders)
- Ichimoku Cloud (advanced crypto indicator)
Featured Partner
Kraken
Best Exchange To Buy Bitcoin
4.8 out of 5.0
Kraken is a top-rated and regulated exchange best known for its safety and multiple methods to buy Bitcoin and crypto worldwide.
222
USD, GBP, EUR, CAD, CHF, JPY & AUD
Bank transfer, SWIFT, SEPA, debit and credit card
0.16% (maker) and 0.26% (taker)
Definition of Crypto Indicators
Crypto trading indicators are a type of technical analysis (TA) that uses algorithms and formulas on cryptocurrency charting platforms to identify current or future trends in the market. An indicator's calculations typically rely on an asset's past price performance or trading volume. Technical analysis indicators can measure a range of market metrics but are most often used to find trading opportunities (or “signals”). The amount of data input or output by indicators can usually be adjusted according to an investor's desire, for example, if they want to identify short- or long-term trends.
Best Technical Indicators For Crypto Trading: Explained
1. Moving Averages
Moving averages (MAs) are a group of technical indicators that take a cryptocurrency’s closing prices over a certain period and smooth them into one line. There are two key types of moving averages – the Simple Moving Average (SMA) and the Exponential Moving Average (EMA). The timeframe of the price data fed into a MA will significantly affect its output and can be adjusted depending on whether the trader wants to identify short- or longer-term trends.
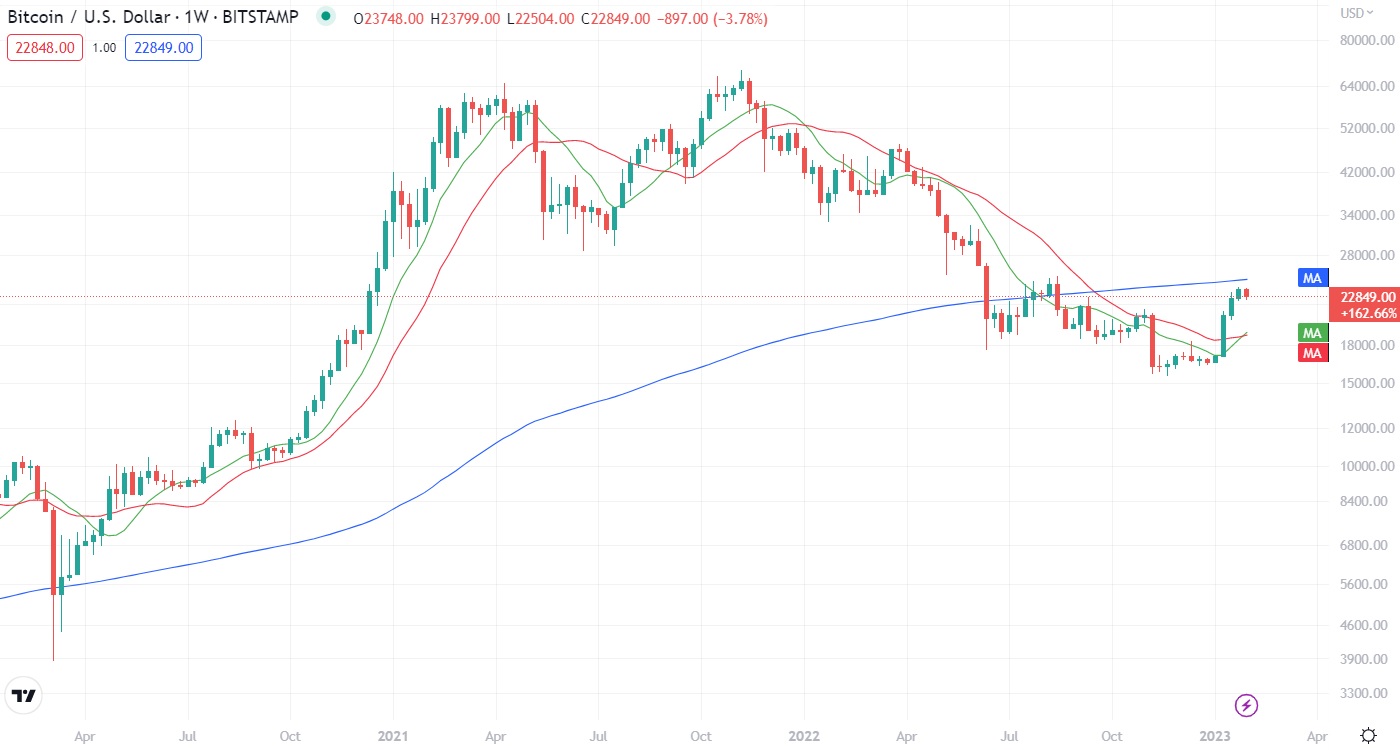
For those wanting to trade cryptocurrency for the first time, moving averages are a viable starting point for traders to take noise and volatility out of their charts and clearly see market trends. More complex indicators like the EMA can also be valuable when determining support and resistance levels. For example, if Bitcoin’s price closed lower than its moving average, it might mean that traders are beginning to sell BTC at a specific price point (its resistance level).
2. Moving Average Convergence Divergence (MACD)
The MACD sounds complex but is actually a straightforward indicator that tracks price trends and their corresponding momentum. The MACD is an oscillator, meaning that it displays data between two separate bands and is often used to identify potential momentum shifts in already-trending markets
There are three elements to trading the MACD indicator in crypto:
- MACD line. The distance between two Moving Averages (one measuring the average price over 12 days, and the other 26).
- Signal line. A Moving Average of the MACD line, set to nine days.
- MACD histogram. A bar graph demonstrating how close the MACD and signal lines are.
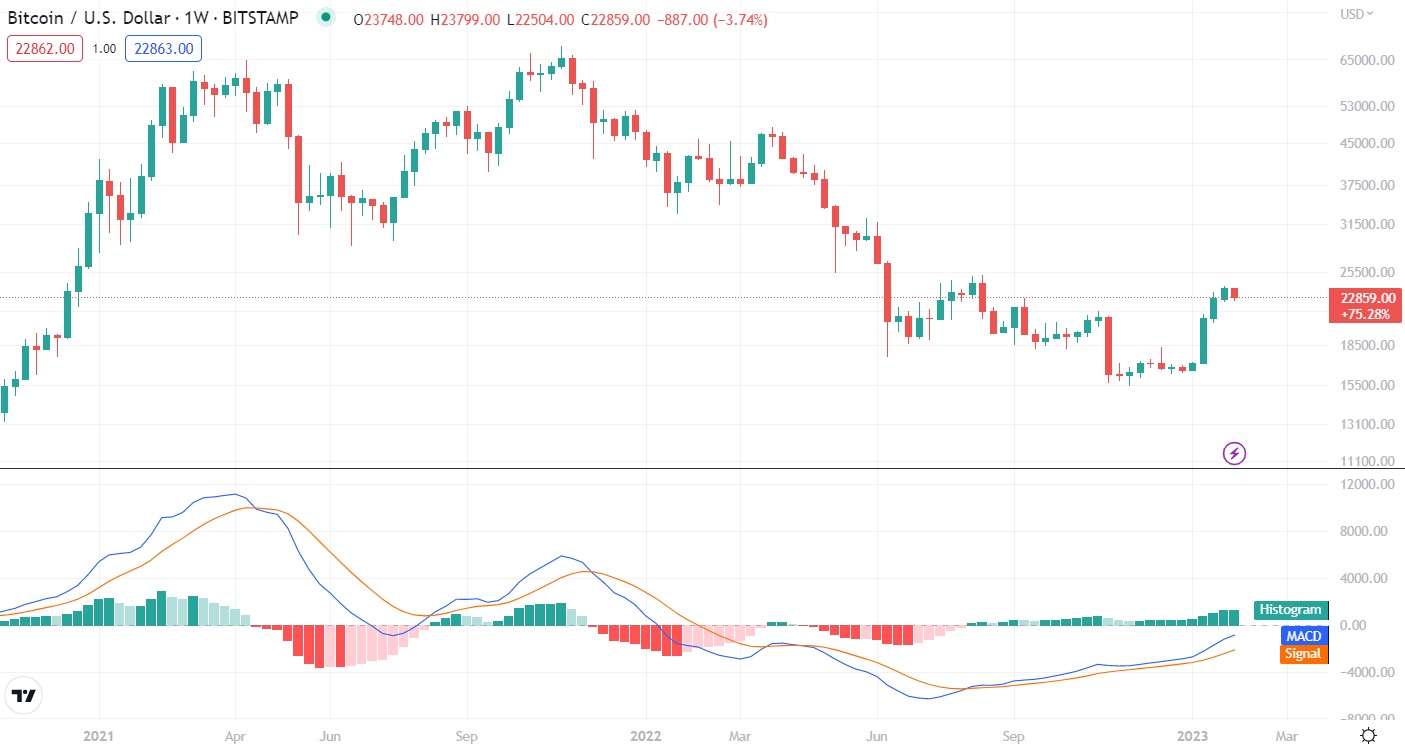
The MACD is a well-used indicator to identify trading signals when there is a “signal line crossover”. This occurs when the MACD line rises or drops below the signal line, causing a crossover. The MACD crossing above the signal line is often considered a buying opportunity (a positive crossover). A negative crossover is typically interpreted as a sell signal.
The MACD indicator is one of the most useful cryptocurrency tools for identifying trend reversals and potential entry/exit points, but it isn’t very reliable in sideways markets. Overall, MACD is a reasonable reversal indicator but should be combined with other trading indicators like the RSI to confirm bullish or bearish trends.
Learn how to use MACD in crypto trading.
3. Relative Strength Index (RSI)
RSI is a very popular momentum indicator that is used for crypto trading. Similar to MACD it is commonly used to identify overbought and undersold market conditions. During the extremities, traders can look for a correction. The RSI is displayed as a moving line underneath most typical candlestick charts. It’s a formula that divides price gains by price losses over two weeks to deliver a number between 0 and 100. This figure is used to determine whether an asset is overbought (an RSI of 70+) or oversold (an RSI of 30 or less).
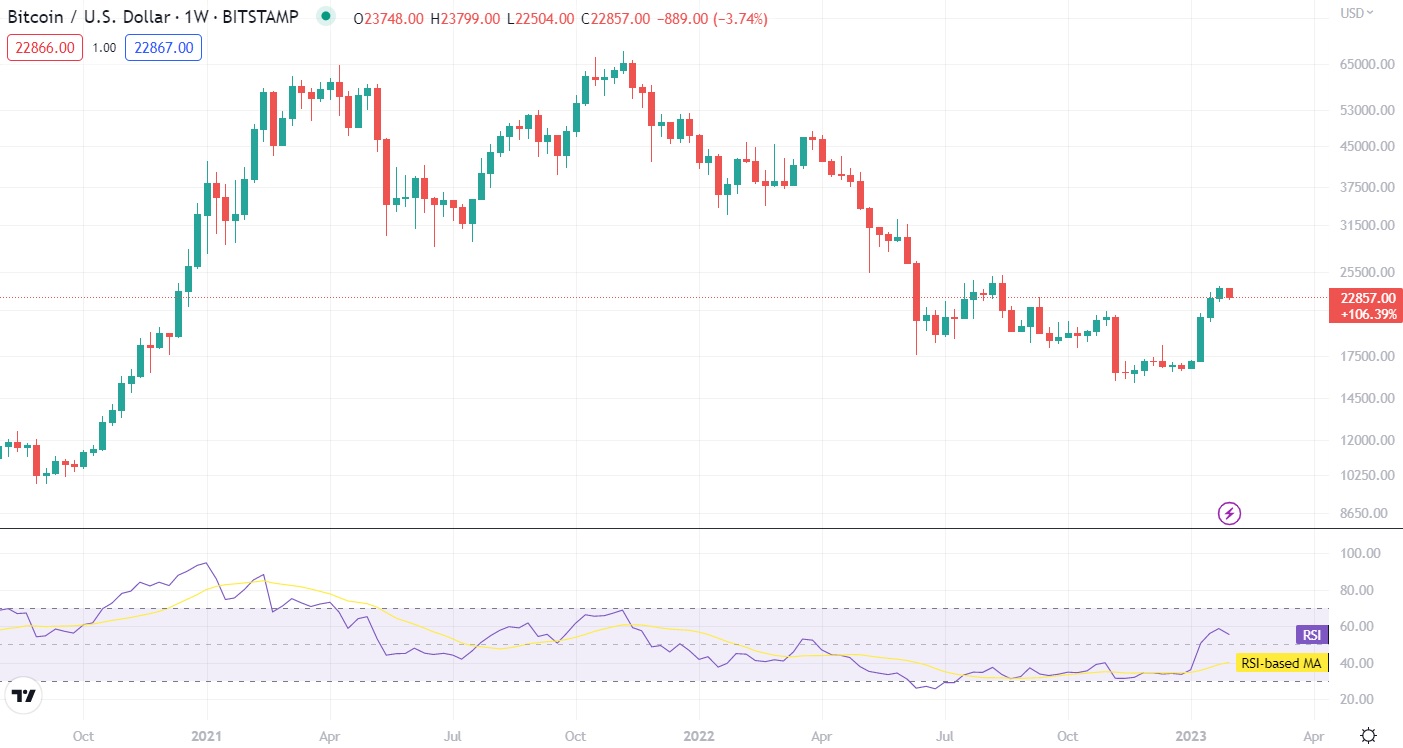
For example, if a crypto pair breaks through an RSI of 30 and continues to make higher highs. If this movement is paired with increasing price action, it suggests a strong upward trend. Conversely, an RSI that hits 70 might signal the beginning of a price reversal and a potential selling point for traders.
One of the best crypto trading strategies to use with RSI, which can also provide trading signals is divergences. A divergence occurs when the RSI action is moving contrarily to the price action of an asset. If the RSI is consistently moving up (higher lows) while the value of crypto is dropping (lower lows), it suggests a trend reversal is imminent and that there’s a potential buying opportunity.
In short, the RSI indicator for crypto trading is an excellent tool for measuring trend strength and spotting shifts in momentum. However, as a momentum indicator, it is less effective in a sideways market. Given its overall simplicity, most traders can benefit from using the RSI in their analyses.
Learn how to use the RSI indicator in crypto trading.
4. Bollinger Bands
Bollinger Bands are a useful indicator that can measure trend strength and plot it alongside volatility. Like the RSI, the Bands can help identify overbought or oversold trading conditions for a digital asset. The indicator comprises three elements:
- Middle band (Simple Moving Average). A line that measures an asset’s average closing price over a set timeframe, set by default to 20.
- Upper band. A positive standard deviation of the SMA.
- Lower band. A negative standard deviation of the SMA.
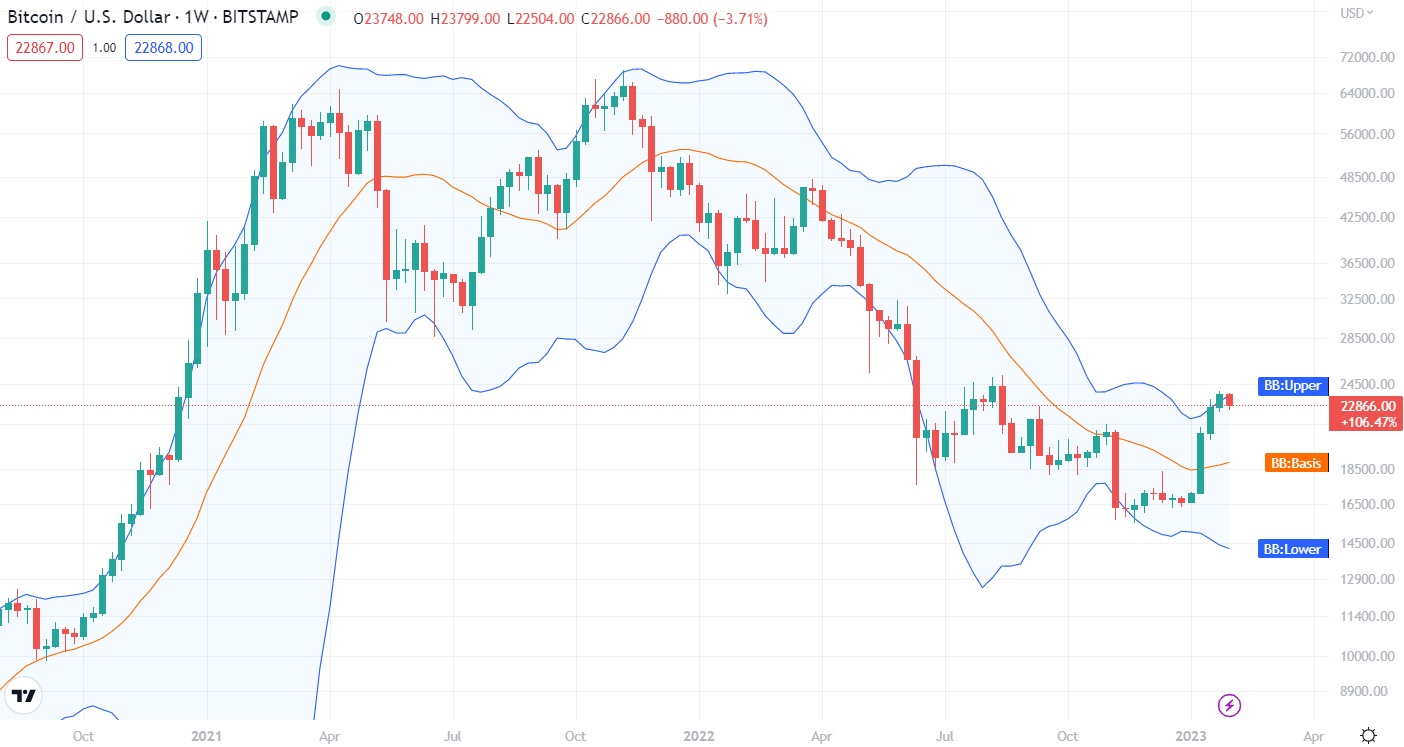
Bollinger Bands can be quite simple to read. Most price movements will occur within the upper and lower bands. When the price action of crypto breaks through the upper band, this might indicate overbought conditions and an impending trend reversal. The inverse is true too. The distance between the upper and lower band can also be used to identify market volatility (the wider the gap, the greater the volatility).
A common crypto trading strategy involves “riding the bands”. Basically, investors will buy an asset when its price drops under the lower band, and sell when it breaches the upper band (the success rates are better on higher timeframes). However, this should never be used as a sole trading strategy and Bollinger Bands are most effective when paired with other indicators like the RSI and reading price action.
Learn how to trade Bollinger Bands in the crypto markets.
5. On-Balance Volume (OBV)
On-Balance Volume is a technical indicator that is used to determine momentum. Unlike a momentum indicator, OBV utilizes trading volume data and price action. The prevailing theory behind an OBV is that high levels of trading volume will eventually result in significant price movements.
The exact algorithm backing the OBV indicator is a little dense. Put simply, it measures the cumulative value of volume depending on whether an asset’s price closed higher or lower than the previous day. The indicator is best used to confirm trends and identify momentum strength. For example, if a coin’s price is trending upwards but the OBV indicator is flat-lining, it may signal an upcoming shift in direction.
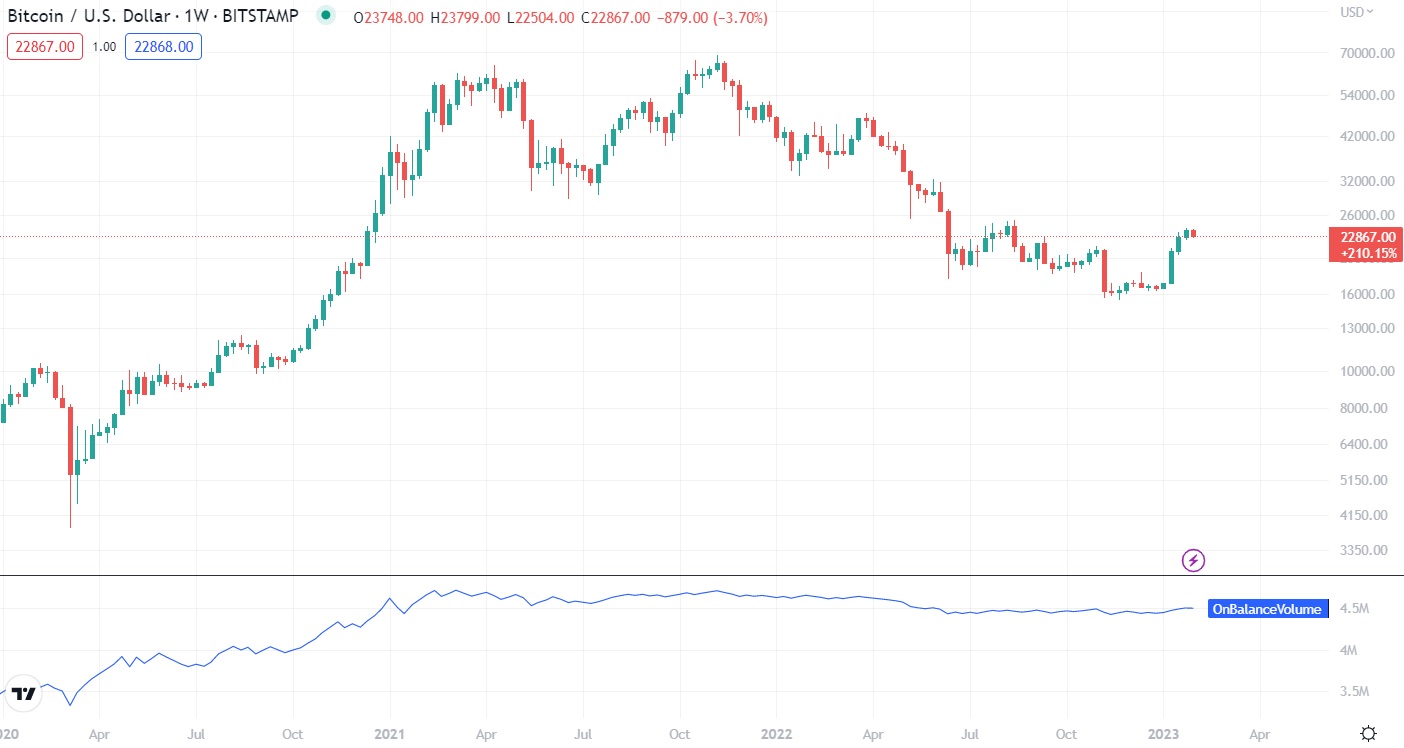
Another powerful strategy is trading OBV divergences. These occur when the OBV indicator is making higher highs, while the price of an asset is making lower lows. This is referred to as a “bullish divergence” and can signal an entry opportunity.
As with most momentum indicators, OBV is less effective during sideways or consolidating markets. It is most reliable when confirming established trends and identifying reversals. For the indicator to work at its best, it should be combined with other trading indicators like the RSI or MACD.
6. Ichimoku Cloud
The Ichimoku Cloud is one of the most intimidating and complex technical indicators available to traders. Visually, it is a little cluttered and it will take investors a little while to get the hang of using it. However, when used correctly it is one of the most effective crypto indicators for identifying the direction of a price trend. The Cloud comprises five major components:
- Tenkan-sen. A moving average of a crypto’s 9-day price highs and lows.
- Kijun-sen. A moving average of a crypto’s 26-day price highs and lows.
- Leading Span A. A moving average representing the midpoint of the Tenkan-sen and the Kijun-sen lines.
- Leading Span B. A moving average of a crypto’s 52-day price highs and lows. Leading Spans A and B combine to form the “cloud”.
- Chikou Span. The current price action plotted 26 days ago on the chart.
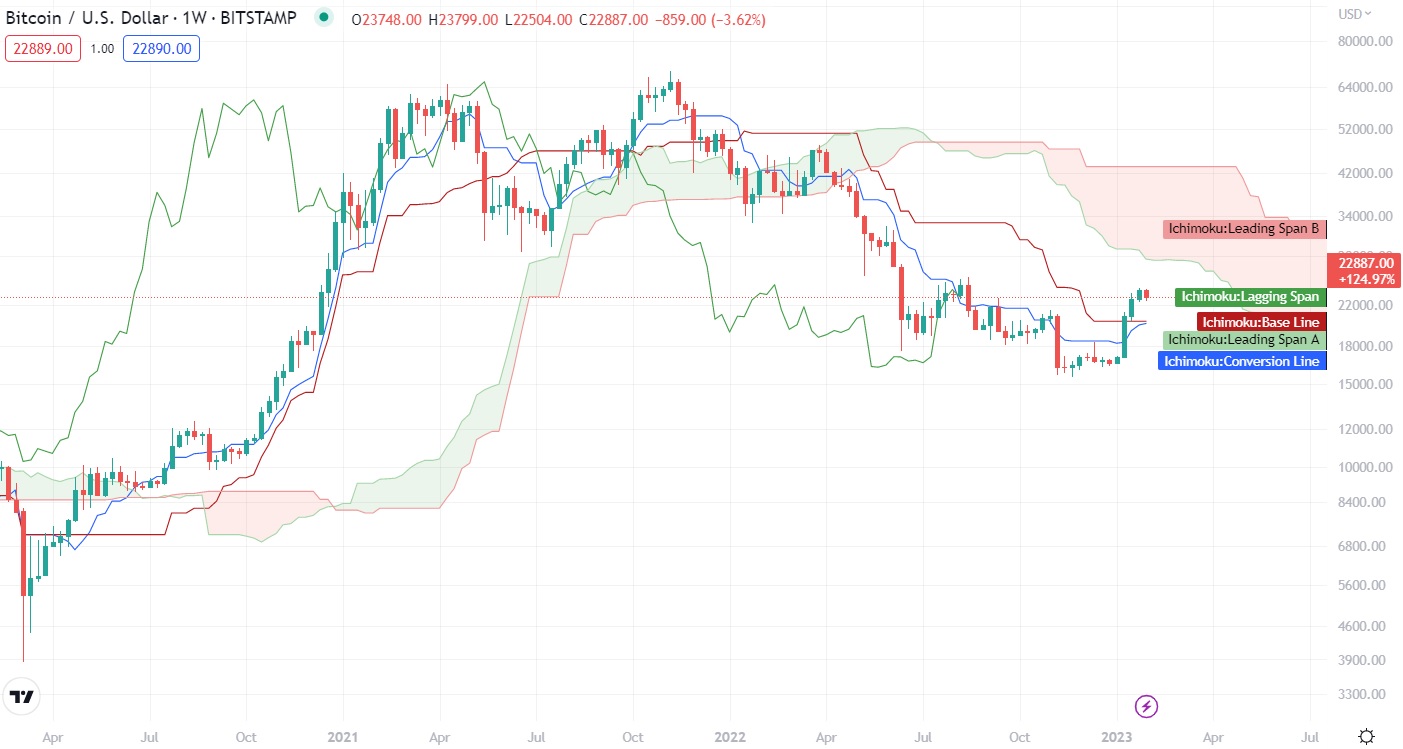
The easiest way to interpret the Ichimoku indicator is by looking at the cloud (a filled-out area between the Leading Span A and B lines). If a crypto’s price is above the cloud, this suggests a positive trend. However, if the price action falls below the upper line of the cloud, this may signal an incoming reversal – or vice versa.
The Ichimoku Cloud is used to identify support and resistance levels, evaluate the strength of trends, and signal shifts in momentum. Given its complexity, the Cloud is not suitable for all users. However, with the correct settings, the Ichimoku Cloud trading strategy can be very profitable with good risk-to-reward signals.
Types of Technical Indicators For Crypto
Trend indicators
Trend indicators are usually quite simple and often incorporate “moving averages” from timeframes of one month or more. This umbrella group of indicators is used to identify longer-term trends in an asset or market's price action. For example, a trend indicator may show that a seemingly underperforming asset has actually been on an upward trend over the past six months. Trend indicators are only somewhat reliable on their own because they use historical market data. However, when paired with momentum indicators, they can help investors identify which direction the market is most likely to move.
Example indicators: Simple Moving Average (SMA), Exponential Moving Average (EMA).
Momentum indicators
Momentum indicators are very similar to trend indicators and the terms are sometimes used interchangeably. However, the key difference is momentum indicators usually signal price direction over a shorter timeframe and the strength or weakness of the underlying trend. Momentum indicators will often measure the rate of a price movement, which can be helpful when trying to predict future market trends.
For example, momentum indicators might identify Ethereum rising 15% over seven days as being a weaker bullish trend, with the potential for a fast reversal. This could be interpreted as a sell signal when many others would assume the opposite. Momentum indicators usually perform best during bull markets and aren't typically as useful when measuring sideways price action.
Example indicators: Relative Strength Index (RSI), Moving Average Convergence Divergence (MACD).
Volume indicators
Volume indicators are mathematical algorithms that measure different elements of a crypto's trading volume over a specified timeframe. Buying (or selling) volume can be incredibly useful for confirming trends or momentum reversals identified through other indicators. Because volume indicators don't usually rely on price data, they can give early signals for an asset jumping or sinking in value.
For example, an altcoin with a serious uptrend might have a relatively low trading volume. This would signal a weak trend with little momentum. On the flip side, if a digital currency were falling in value with heavy trading volume, it suggests the downturn would carry on for a while.
Example indicators: On-Balance Volume (OBV), Money Flow Index (MFI).
Volatility indicators
Volatility indicators identify how far an asset strays from its average price. They are particularly effective when trading cryptocurrency, a notoriously volatile market. Low periods of volatility are usually associated with weakened trading volume and less price movement. High volatility suggests wild price swings and lots of market activity.
Volatility indicators don't measure the direction of trends, but rather, the degree of price movement. Therefore, they are most effective when combined with trend/momentum indicators to identify potential entry and exit points. Most traders typically recommend the best time to trade crypto assets is during periods of low volatility and selling during high volatility due to the lessened risk. However, high-volatility markets are also more likely to present money-making opportunities.
Example indicators: Bollinger Bands, Volatility Index (VIX).
Market sentiment indicators
Unlike the other macro indicators we've explored, market sentiment indicators usually comprise fundamental analysis (FA). Fundamental analysis doesn't rely on quantitative data like price and volume action, but rather metrics like project developers, social media presence, and the industry's overall performance. Market sentiment indicators will usually boil down a variety of information derived from FA and TA (such as Twitter trends, Bitcoin dominance, trading volume, etc.,) into one number. Such algorithms aren't usually useful for plotting individual trades but can be an excellent way to determine the current market cycle and plan a strategy around it.
Example indicators: Crypto Fear & Greed Index.
Why You Need To Use Crypto Indicators
The adept use of prominent trading indicators can signal a digital asset's likely short and longer-term momentum. Moreover, crypto indicators can be used to identify shifts in momentum such as a possible reversal point. Finding the “bottom” is never easy, but indicators can help traders make better decisions. The inverse is true too – indicators can be used to get out of a failing investment before the rest of the market realizes it's too late. For more experienced traders, technical indicators can be automated into a strategy using cryptocurrency bots to find and execute trading opportunities.
How To Use Crypto Indicators
Understand the types of crypto indicators
It’s vital that investors are across the various types of crypto indicators before they start trading. Different indicators can help identify different things. For example, day traders trying to identify buy/sell opportunities will likely use a momentum indicator. However, longer-term trading strategies might benefit more from market sentiment indicators.
Choose an indicator to use
For those just getting started, the sheer number of indicators available can be a bit overwhelming. That’s why it’s a good idea for investors to choose a couple of beginner-friendly indicators that will benefit their fundamental trading strategy. The RSI, Moving Averages, and Bollinger Bands are all good starting points.
Learn how to interpret the indicator signals
Each indicator will present signals in its unique way. Generally, there are a few principles that are transferable across tools – such as bullish and bearish divergences. Learning the basic signals by heart will help traders react quickly to potential opportunities in the future. It will also make them less susceptible to false signals.
Set up the indicator on your trading platform
Trading platforms will come with in-built charting and crypto trading indicators. Inexperienced traders can use the indicator’s default settings, but more advanced investors will likely adjust parameters depending on their goals. For example, longer-term traders might use larger timeframes for their Moving Average indicators.
Test the indicator
It’s a good idea to use an indicator on market data from the past to ensure it is working optimally. This can help avoid falling for false trading signals.
Use the indicator as part of the trading strategy
An indicator should never be the only form of analysis in any trading strategy. However, they can form the backbone of a comprehensive plan when used to confirm trends and identify potential buy/sell opportunities.
Continuously monitor the market and adjust indicator settings
As investors gain experience, their goals may change over time. Similarly, a bearish crypto market would likely require different indicators (or indicator settings) compared to a bullish one. Keeping on top of each indicator and ensuring the settings are optimized for the current market conditions is vital to making successful trades. When deployed effectively, technical indicators provide valuable insight into the trends, momentum, and sentiment of the crypto market particularly when combined with other metrics such as open interest and crypto liquidation levels.
Best Practices For Using Crypto Indicators
- Do not solely rely on indicators. Indicators provide suggestions, not facts – and are open to interpretation. These are useful trading tools, but they are not 100% reliable. Novices are particularly prone to falsely interpreting trading signals. To increase the probability of successful crypto trades, combine indicators with key support and resistance levels, or use Fibonacci retracements on crypto swing positions.
- Use multiple indicators. Although indicators will never be completely accurate, they will always work more efficiently in tandem. As different tools measure different market metrics, combining multiple indicators can help confirm (or reject) trends and trading opportunities.
- Combine indicators with fundamental analysis. Technical analysis is only one aspect that can impact an asset’s price. This is especially true in the crypto market which is largely driven by sentiment, speculation and sometimes hype. Therefore keeping an eye on market news and events can help improve trading decisions.
- Use chart patterns as additional confirmation. Relying on indicators alone can provide false signals to enter a position. Combining indicators with powerful crypto charting patterns can increase the win rate percentage.
- Indicators are often lagging. Indicators often use historic price and volume data, which means they aren’t always reliable for predicting the direction future price movements. Technical analysis is most effective when used in a trending market. They are much less useful in sideways markets.
- Misleading and false signals. A common trap for beginners is to overreact to the first trading signal they see. False signals occur when technical analysis suggests one thing, but the opposite occurs. Utilizing multiple indicators to double-check potential trading opportunities can help avoid this pitfall.
Ben Knight
Ben Knight is a freelance writer with a passion for music and finance from Melbourne, Australia. He completed his Master's in Writing, Editing, and Publishing in 2019, following a Bachelor's degree in Creative Writing. Ben has been writing in the finance and cryptocurrency industry for more than three years.