We may earn a commission from links on our site, but this doesn’t affect our reviews. Learn more.
Hedge With Crypto is an independent publisher that provides objective and free content. Articles on our site may include links to our partners. If you click on these links, we may earn a commission. However, our editorial content remains unbiased, reflecting our own opinions or the general information available. For more information on our company policies, read the Affiliate Disclosure, Privacy Policy, and Terms & Conditions.
How To Use MACD In Crypto Trading
MACD is a powerful technical indicator when use correctly. Here are the different ways to trade MACD in crypto with a step-by-step tutorial.
Hedge With Crypto aims to publish information that is factual and accurate as of the date of publication. For specific information about a cryptocurrency exchange or trading platform please visit that provider’s website. This information is general in nature and is for education purposes only. Hedge With Crypto does not provide financial advice nor does it take into account your personal financial situation. We encourage you to seek financial advice from an independent financial advisor where appropriate and make your own enquiries.
TABLE OF CONTENTS
Moving Average Convergence Divergence (MACD) is one of the most popular technical indicators for analyzing crypto. The momentum indicator is used to great effect by experienced traders and crypto newcomers. Utilizing the MACD alongside a cryptos price chart can provide important insight into the future direction of the market. But what is the MACD in crypto, how to use MACD when trading, and are there any downsides to charting with it?
Featured Partner
Kraken
Best Exchange To Buy Bitcoin
4.8 out of 5.0
Kraken is a top-rated and regulated exchange best known for its safety and multiple methods to buy Bitcoin and crypto worldwide.
222
USD, GBP, EUR, CAD, CHF, JPY & AUD
Bank transfer, SWIFT, SEPA, debit and credit card
0.16% (maker) and 0.26% (taker)
How To Use MACD Indicator To Trade Crypto
1. Open the crypto charts
To perform technical analysis on trades, we first must get crypto charting software that supports indicators. There are all sorts of options available here – the trading interfaces of several prominent exchanges have in-built, customizable charts, thanks to their partnerships with TradingView (our recommended pick). Alternatively, traders can go straight to the source and make an account themselves on the browser version of TradingView. It is free to examine the price action of several cryptocurrencies alongside the MACD indicator overlay on this platform.
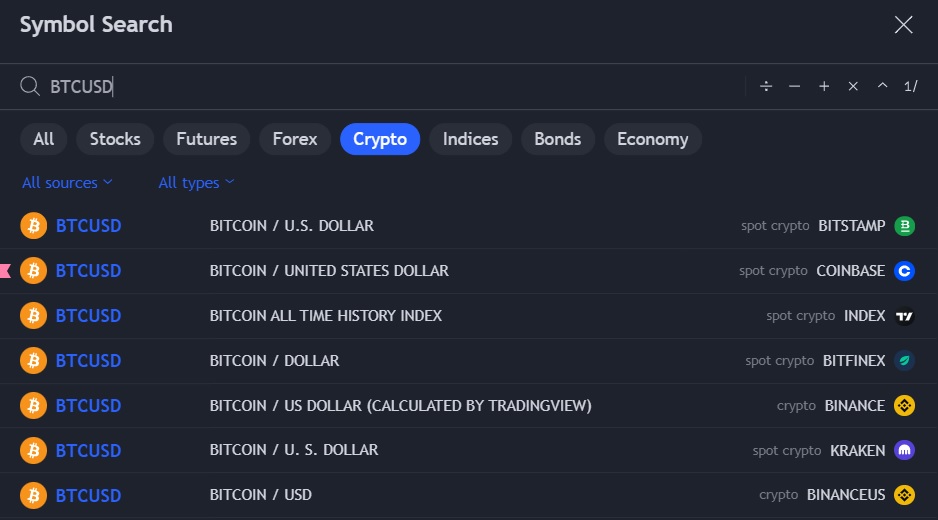
2. Find and select the cryptocurrency trading pair
Most charts will support hundreds of trading pairs, such as BTC/USD, ETH/AUD, and XRP/BTC. Users can easily search for a specific trading pair via TradingView's “symbol search”. For particularly popular pairs (like BTC/USD), there will often be many separate results of the same assets. This is because each crypto exchange prices its coins differently.
Therefore, it's a good idea for the trader to select the pair linked to the spot price of their preferred exchange. For example, someone that used BTC/USD based on Coinbase's spot price should likely trade on that exchange.
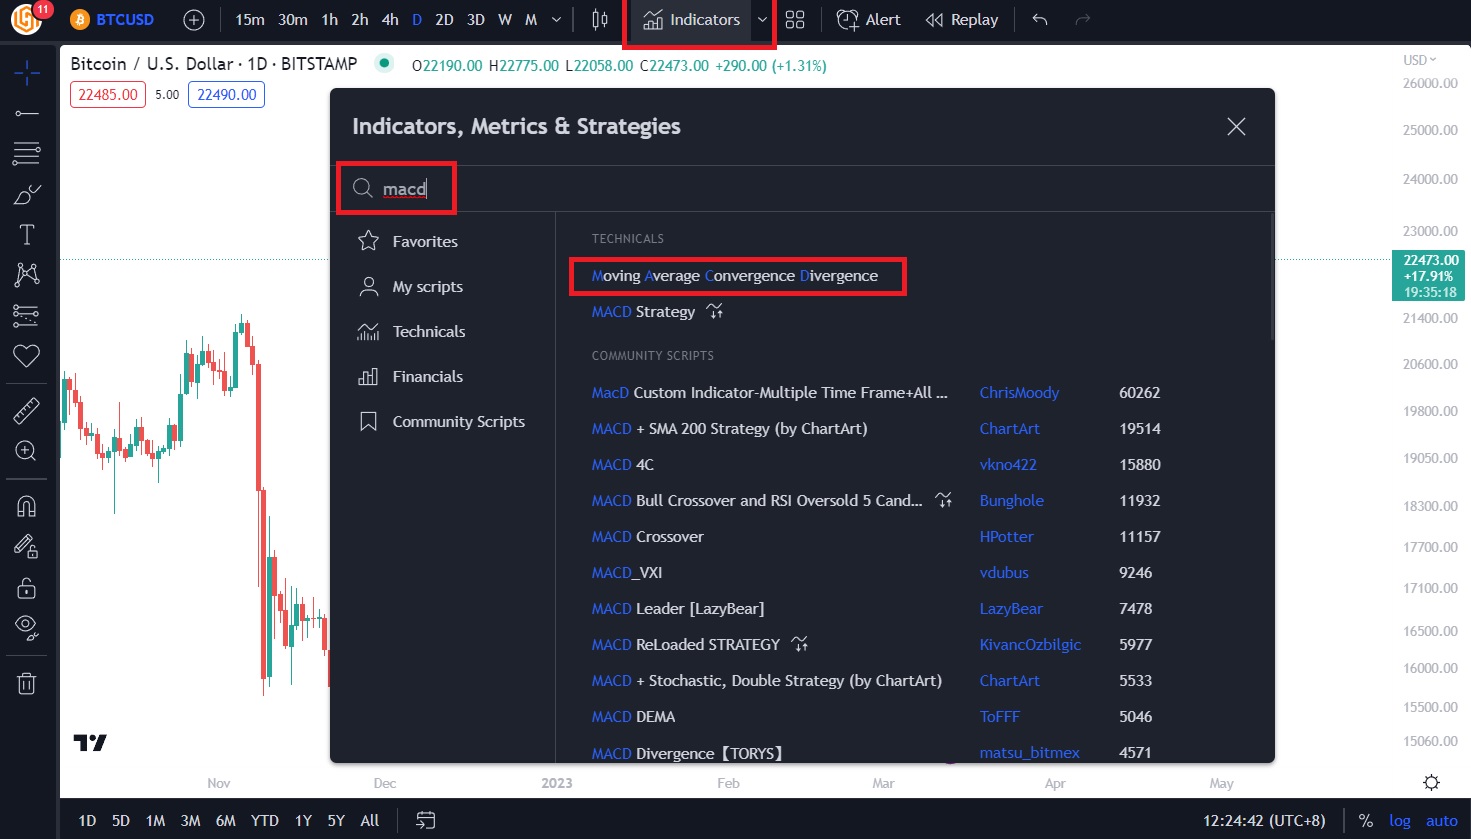
3. Find and add the MACD Indicator
Now we have the correct chart open, simply click on “Indicators” which will appear above the price graph. In the search bar, type “MACD” to bring up the desired analysis tool. Clicking it will automatically add it to the chart with the indicator's default settings.
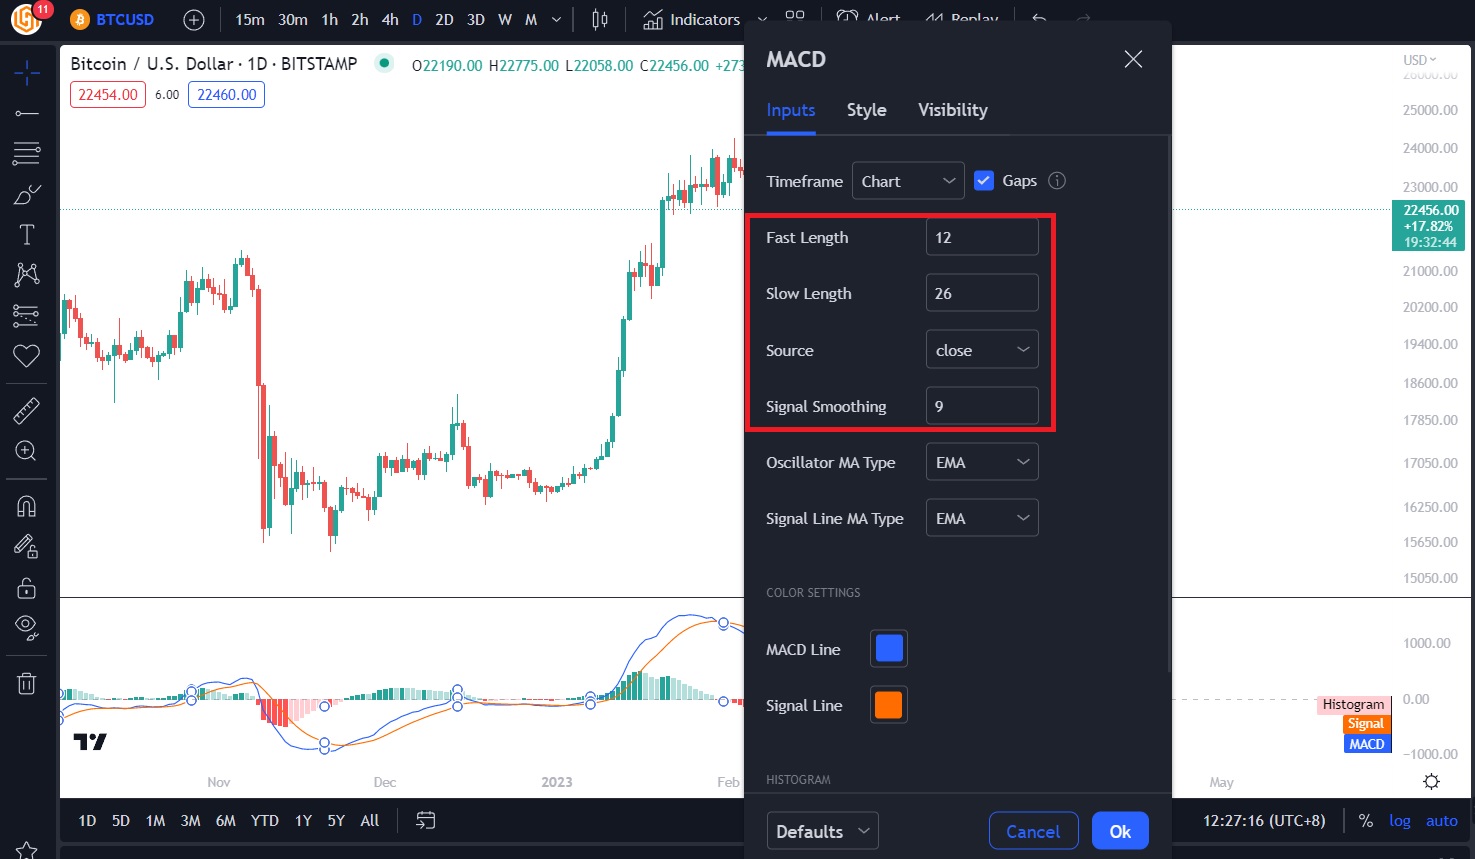
4. Adjust the MACD settings
Beginner traders should stick to the default MACD settings (12,26,9) as these apply to most general situations. However, traders can also set up more, or less, sensitive MACDs to acquire different information. Faster and more sensitive MACDs (e.g., 5,34,1) can provide investors with more buying opportunities (but also more false trading signals). More conservative MACD settings (e.g., 24,68,18) will give fewer signals but can help with longer-term exits. For most, the best MACD indicator setting for crypto trading is the default.
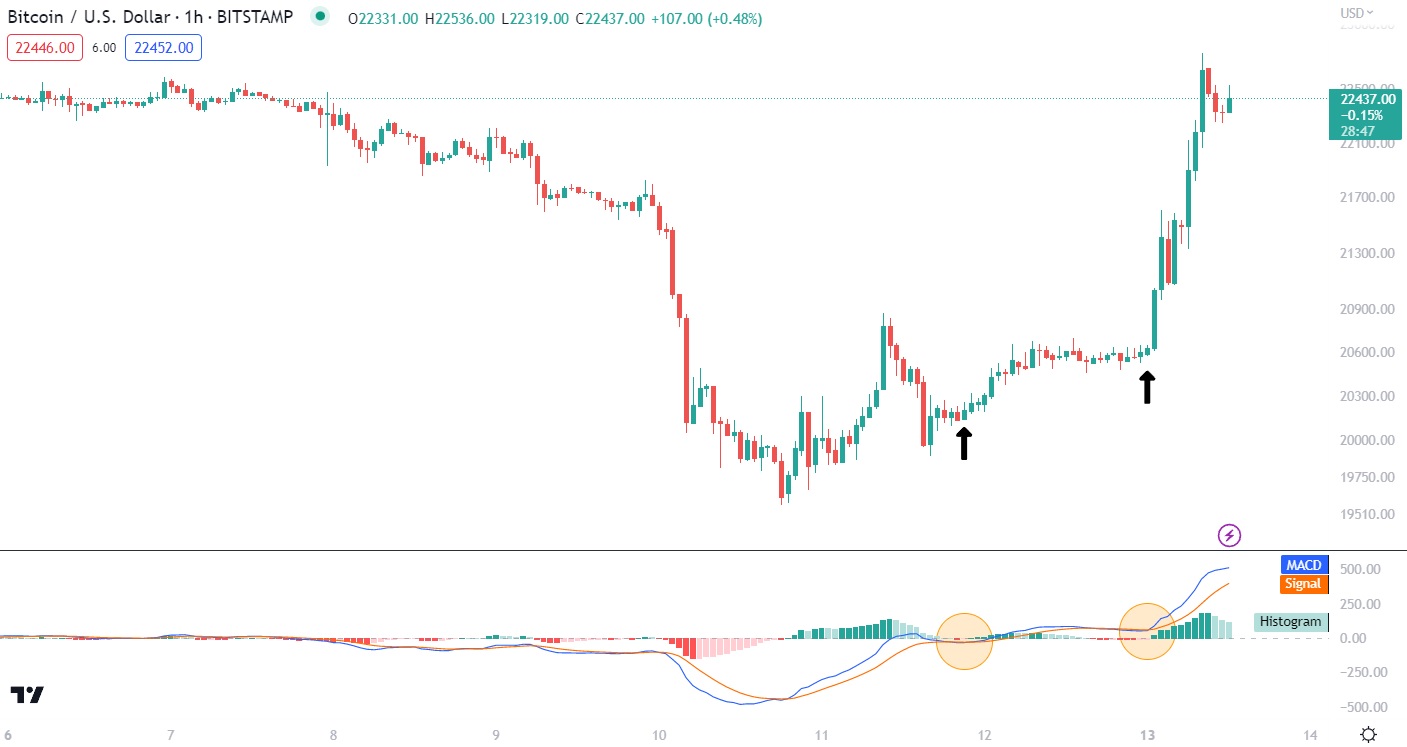
5. Use the MACD to identify signal line crossovers
The MACD's most ubiquitous and easiest-to-spot trading signal is called a signal line crossover. This occurs when the MACD line (usually blue) crosses above or below the signal line (typically red). Signal line crossovers are generally considered momentum indicators that are most effective when read within the context of current trends. For example, a positive signal line crossover (when the MACD line moves above the signal line) is often used to confirm a market entry position.
6. Confirm potential entry and exit points
Once a trading signal has been identified with the MACD, investors should always confirm the trend using other forms of analysis. The MACD – or any indicator for that matter – should not be the sole signal that informs an investor's trades. Rather, the MACD can be used with several other indicators to help round out a nuanced trading strategy. For example, a trader identifying a positive signal line crossover might add another oscillator (like the RSI) to their chart to check for oversold conditions.
7. Place orders according to the MACD strategy
There are numerous ways for beginners to trade cryptocurrency using the MACD indicator as their primary strategy. Signal and centerline crossovers are the easiest signals to identify and when used in confluence trading, can help determine viable entry and exit positions.
Of course, no trading strategy can be 100% foolproof – so it is integral for all investors to employ some form of risk mitigation. A key to this is using advanced order types such as stop-losses and take-profits. Most prominent trading exchanges such as Binance and ByBit will have stop-loss and take-profit orders. Setting up these fail-safes beforehand helps traders stick to their strategy and avoid emotions like greed and fear.
Related: How to use the crypto greed and fear index.
What Is The Moving Average Convergence Divergence (MACD) In Crypto?
The Moving Average Convergence Divergence (MACD) is a momentum oscillator used to plot the trend of an asset between two bands. The MACD is designed to be a low-maintenance, straightforward technical indicator that updates investors with information on trend strength. Additionally, the MACD can inform traders on overbought/oversold conditions, which can be used in confluence trading to identify potential buy and sell opportunities.
The MACD was invented by the seminal technical analysis author Gerald Appel. Appel, who passed away in 2020, created the MACD as an easily-implemented technical indicator to measure momentum strength. The MACD is still widely used now, nearly forty years after its creation, a testament to its simplicity yet effectiveness.
MACD Indicator Pros:
- Simple indicator that provides lots of useful information
- Powerful signal when used alongside the RSI, another simple momentum oscillator
- Easy to identify trading signals
MACD Indicator Cons:
- False trading signals are common when the MACD is used in isolation
- MACD is often best suited to shorter-term traders
- Lagging indicator which means signals can occur after the market has already shifted
How Does The MACD Work?
The MACD is built upon three different data points. This data is represented as (x,y,z) in the indicator's settings, or most commonly, 12,26,9. All three data points come from another technical indicator – the exponential moving average (EMA). The EMA is a smoothed average of price action that weighs recent price trends higher than older ones.
The first two EMAs use the price action of the asset being charted. The “fast” EMA is typically set to 12 periods, while the “slow” EMA is usually 26 periods. The MACD then subtracts the slow EMA from the fast EMA to create a single, aggregate line known as the MACD line.
Finally, the indicator will create an EMA based on the MACD line's movement over the past nine days (by default). This is typically plotted as a red line, commonly referred to as the signal line. The signal line is primarily used to identify trend momentum and potential shifts, as opposed to the MACD line's depiction of price action.
The MACD indicator includes a histogram as a bar graph plotted above and below the chart's centreline. The histogram portrays how close (or far apart) the MACD and signal lines are in an easy-to-interpret manner.
Different Ways To Trade The MACD In Crypto
Crossovers and divergences are the two most prominent signals identified when using the MACD indicator. They can help find trend reversals and potential entry/exit points, especially when further analyzed. It's worth remembering that the MACD is significantly more effective during already-trending markets. Its signals are far less reliable when used in a sideways (ranging) market.
Signal line crossover
Signal line crossovers are the most frequent signal traders identify when utilizing the MACD indicator. These occur when the MACD line breaches the signal line in either direction. If the MACD line rises above the signal line, this is known as a positive signal line crossover. The inverse scenario is called a negative (or bearish) signal line crossover.
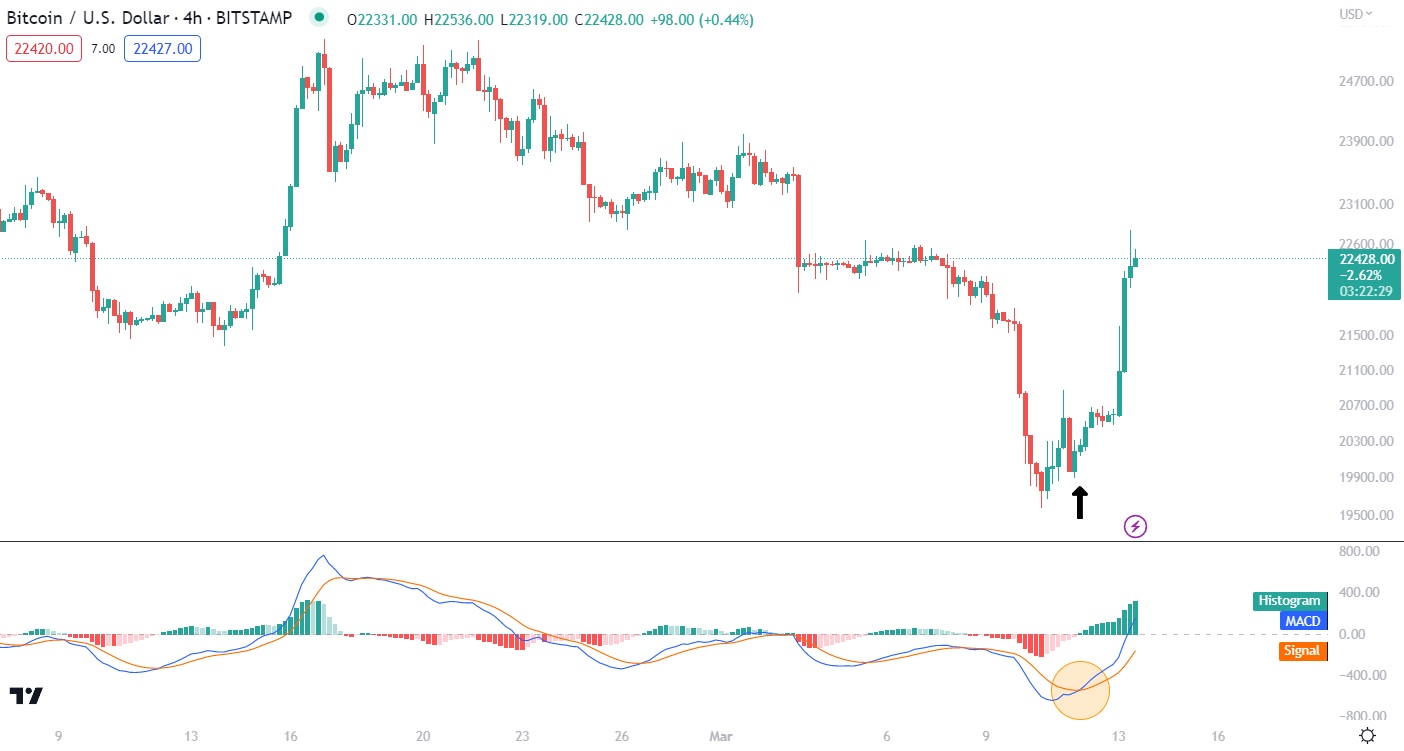
In very simple terms, positive signal line crossovers indicate a potential price breakout and suggest an entry point for riding a bullish trend. Conversely, negative signal line crossovers can be used as a sell signal as it indicates an impending bearish trend.
Signal line crossovers are simple and effective, especially for inexperienced traders with relatively straightforward strategies. However, the MACD's crossover signals tend to be more effective as a form of bullish or bearish confirmation, rather than the initial buy/sell signal. Additionally, positive signal line crossovers that occur below the chart's center line are often unreliable.
Centerline crossover
Centreline crossovers are a prominent trading signal that can be found when analyzing a crypto asset with the MACD indicator. These crossovers occur when one of the MACD line's EMAs (by default, the 12-period or 26-period EMAs) becomes greater than the other. They are visually represented by the MACD line dropping above (or below) the MACD histogram's centreline.
For example, a negative centerline crossover occurs when the MACD line falls below the centerline. This is due to the 26-period EMA becoming more valuable than the 12-period EMA and can signal an incoming downward trend.
On the other hand, a positive centerline crossover is usually bullish and might indicate a potential entry opportunity. This occurs when the 12-period EMA value becomes higher than the 26-period EMA.
MACD divergences
Identifying price divergences and convergences is another common signal that MACD traders interpret. Like with most other forms of technical analysis, MACD divergences occur when the story told by the MACD indicator contradicts an asset's price action. Divergences can often indicate impending shifts in momentum and sometimes full-blown trend reversals.
There are two types of divergences – bullish and bearish. Let's say a cryptocurrency's price continues to drop by making lower lows. A trader can match the bottoms of this price action to the MACD's graph activity. If the MACD lines are actually making higher lows while the price action is trending down, this is known as a bullish MACD divergence. Such a signal indicates that, despite bearish price action, the overall trend of the asset is still positive.
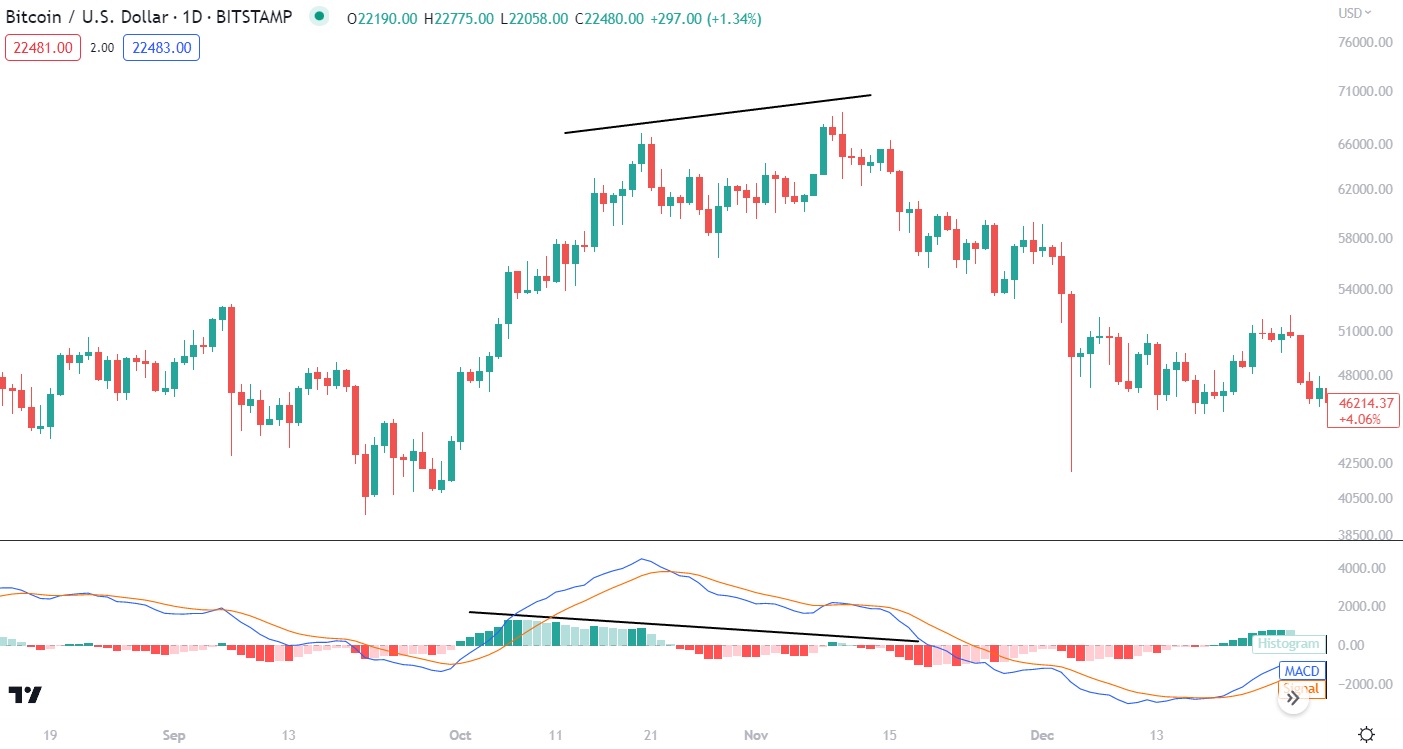
The inverse is true too – if the peaks of an asset's price keep getting higher, while the MACD's peaks keep falling, this is known as a bearish MACD divergence. This suggests the positive price momentum of an asset is to be short-lived, and longer-term bearish conditions may prevail.
Benefits of Using The MACD Indicator
- Simple to implement. The MACD Indicator was invented to be easily used and not require much setting adjustment. This makes it perfect for newcomers to technical analysis who can up their trading game without overwhelming themselves with clutter.
- Basic signals are common and easy to see. MACD crossovers are some of the most visually apparent trading signals of any trading indicator. Investors can easily spot centerline and signal line crossovers, making bearish or bullish confirmations with the MACD fast and efficiently.
- Extremely popular tool. The MACD's simplicity and usefulness mean that it's been used for nearly half a century by both complete beginners and seasoned trading experts.
- Effective with other indicators. The MACD is a great way to quickly confirm trends identified by other leading momentum indicators or drawing overlays such as Fibonacci retracement and extensions.
- Paired with charting patterns. The MACD indicator can be used as the confirmation signal to enter a trade based on a profitable crypto chart pattern. For example, waiting for MACD divergence to occur at a rising or falling wedge pattern.
Downsides of Using The MACD Indicator
- Lagging indicator. The MACD indicator is a lagging indicator that relies on historical data to flag trading signals. Therefore, a buy (or sell) signal from the MACD might come too late, as the market has already rallied and reacted to the shift in trend.
- Not always reliable. The MACD indicator should never form the sole basis of a trading strategy or decision. This is because crossovers and divergences can occasionally be “false signals” and indicate a trend reversal that never occurs. Instead, the MACD is best used to confirm pre-existing trends and form just one part of a holistic trading plan.
- Weak during ranging markets. The MACD's usefulness is significantly weaker during sideways-moving markets. The signals tend to become less reliable and harder to come across than when the MACD is used during already-trending market conditions.
Indicators To Pair With The MACD
- Relative Strength Index (RSI). The MACD and RSI indicator might be the two most popular technical indicators available to traders. These tools are known as momentum oscillators and measure the strength of price action trends. As each indicator uses a different formula to identify a similar metric, the RSI and MACD can confirm or reject buy/sell signals they've interpreted. For example, if the RSI has a reading over 70 (overbought conditions), while the MACD just plotted a negative center line crossover, this would be a stronger exit signal than using either of those indicators in isolation.
- Stochastic Oscillator. The Stochastic indicator is another oscillator that compares a crypto's closing price to its overall price range within a specific duration. Like the MACD, a bullish crossover is one of the Stochastic's most common trading signals. Therefore, a useful strategy for investors is to look out for the “double crossover”, which occurs when both the MACD and Stochastic depict a crossover within a few periods of one another. This is an excellent way to achieve bullish or bearish confirmation and help determine the strength of a momentum shift.
- Bollinger bands. This momentum indicator overlays a simple moving average with bands based on standard deviations of the SMA. The Bolling Band indicator is a powerful signal to identify extreme volatility. Trading within the bands (and the extremities) can offer excellent risk to reward. Combining a Bollinger Band soft signal with a MACD cross-over will add further confluence and increase the probability of a trade setup.
Frequently Asked Questions
Does the MACD work for crypto?
Yes, the MACD indicator can be an effective crypto tool for performing technical analysis on cryptocurrency assets. The MACD can be used when charting crypto like it would be used on any other stock or commodity.
What is the best MACD setting for crypto?
The MACD's default settings (12,26,9) are generally considered the best configuration for using the indicator – especially for beginners. The MACD's settings can be adjusted to suit a specific trading strategy. For example, investors that want more buy/sell signals could make the MACD more sensitive by reducing the MACD EMA duration.
What Does MACD 12, 26, 9 mean?
The MACD comprises three data points – the first two numbers (12 and 26) are combined to form the MACD line. These figures are simply the duration of an exponential moving average (EMA) measuring price action. The final number (9) is the duration of the EMA measuring the MACD line.
Kevin Groves
Kevin started in the cryptocurrency space in 2016 and began investing in Bitcoin before exclusively trading digital currencies on various brokers, exchanges and trading platforms. He started Hedge With Crypto to publish informative guides about Bitcoin and share his experiences with using a variety of crypto exchanges around the world.