Bitcoin Dominance Chart: How To Read It When Trading Altcoins
Key Takeaways:
- Bitcoin dominance refers to Bitcoin's proportionate market capitalization relative to the total cryptocurrency market, representing its share of the overall value and influence within the industry.
- Dominance increases when the price of altcoins declines and the price of BTC increases, but if the price of BTC drops while the price of other cryptocurrencies rises, its market share decreases due to the comparatively larger value of altcoins.
- An increasing bitcoin dominance usually suggests that the altcoin market is slowing.
TABLE OF CONTENTS
The cryptocurrency sector has experienced a mass of growth over the past decade. In 2023, there are over 22,400 different cryptocurrencies listed at the time of writing which can be purchased. And yet, despite the rapid expansion, Bitcoin remains the most dominant cryptocurrency for nearly every metric. So, what is Bitcoin dominance, why is it important, and how to use it when trading Bitcoin?
Featured Partner
Kraken
Best Exchange To Buy Bitcoin
4.8 out of 5.0
Kraken is a top-rated and regulated exchange best known for its safety and multiple methods to buy Bitcoin and crypto worldwide.
222
USD, GBP, EUR, CAD, CHF, JPY & AUD
Bank transfer, SWIFT, SEPA, debit and credit card
0.16% (maker) and 0.26% (taker)
Explaining Bitcoin Dominance
Bitcoin's (BTC) dominance is the proportion, expressed as a percentage, of Bitcoin's market capitalization to the total market capitalization of all cryptocurrencies. Bitcoin dominance is a fundamental concept that helps investors and traders understand what is happening in the crypto market on a macro scale. For example, Bitcoin's dominance may point to crypto market trends and investment opportunities to buy Bitcoin or an altcoin. To properly understand this concept, it’s important to learn about market capitalization.
Bitcoin Dominance Impacts The Crypto Market Cap
Bitcoin's dominance plays a major role in the overall market cap of cryptocurrency. If the price of Bitcoin increases while most other cryptocurrencies suffer losses, the ratio of Bitcoin dominance would increase. Conversely, if the price of Bitcoin substantially decreases and the value of all other cryptocurrencies increases, then Bitcoin's market would decrease since the value of altcoins is proportionately larger.
The easiest way to figure out Bitcoin's dominance is to use a simple formula:
Bitcoin Dominance % = Bitcoin market cap/total cryptocurrency market cap
For example, let’s say the total market cap of all cryptocurrencies is $1 trillion. At the same time, Bitcoin’s market cap comprises about $450 million of this figure. Therefore, the level of Bitcoin dominance would be about 45% or a ratio of 9:20.
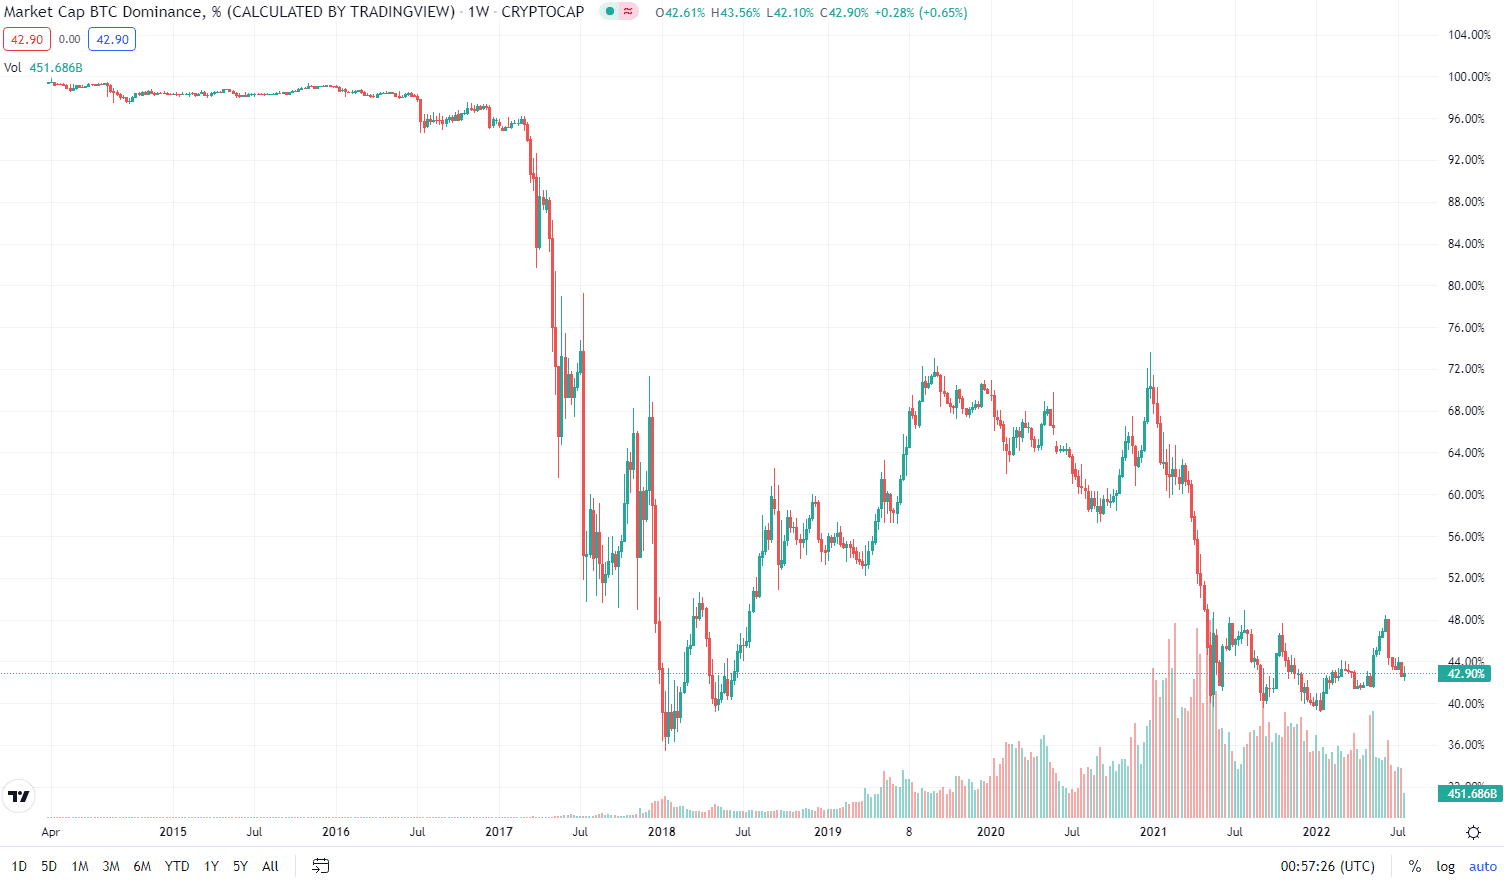
Bitcoin is such a high-value asset that it regularly has a dominance percentage of around 50%. Therefore, the entire market cap of all cryptocurrencies tends to react very drastically to BTC’s price changes. Bitcoin dominance can be charted, so advanced investors can get a closer picture of how the market is trending. The chart is commonly referred to as the Bitcoin dominance index. By comparing this graph to one of the overall crypto market capitalizations, traders can assess how Bitcoin's dominance impacts the industry.
Bitcoin Dominance Is Important For Traders
The most important reason to understand Bitcoin's dominance is what it tells traders about altcoins (with altcoins defined as cryptocurrencies besides Bitcoin). As a general rule, increasing Bitcoin dominance generally suggests that the altcoin market is slowing and sellers are outweighing buyers. Periods of rising Bitcoin dominance often correlate with bear crypto markets, as investors consolidate their portfolios into less volatile digital currencies (or simply liquidate their assets).
On the other hand, decreasing Bitcoin dominance is often due to a spike in altcoin interest. This occurs when the buying power for cryptocurrency is at its highest, and the market is quite bullish.
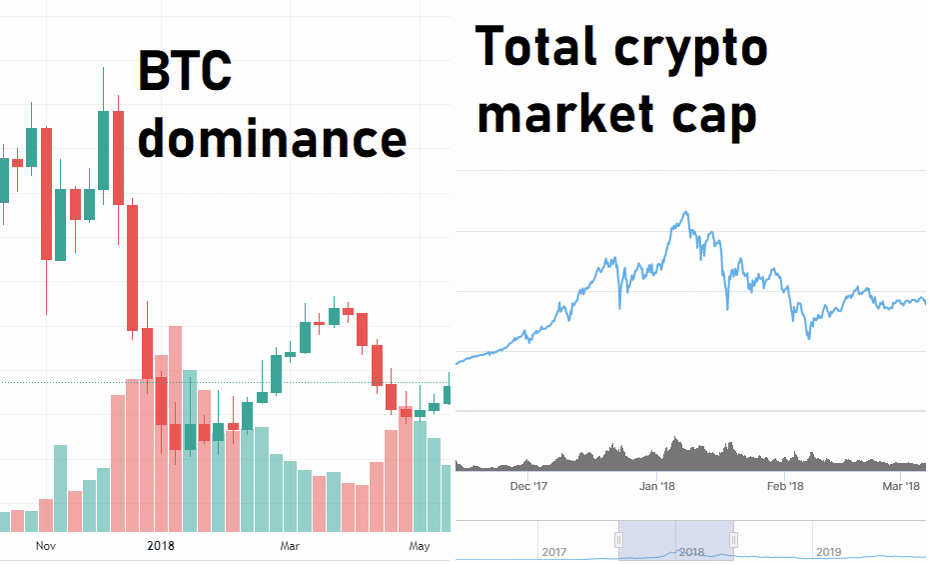
The above graphic compares Bitcoin's dominance and the total crypto market cap. Here, the ratio of Bitcoin dominance dropped dramatically in January 2018 – the same time the bull market reached its peak and the crypto market capitalization hit its then-all-time high. As the crypto market began to lose a bit of steam in March, Bitcoin dominance started climbing again.
This makes Bitcoin dominance a useful analytical tool for investors to determine market sentiment when trading cryptocurrency. However, it should only be used within the context of market trends as a whole. For example, Bitcoin’s dominance was at a particularly low point in June 2022 – approximately 41%. Based on historical data, this might suggest an altcoin surge and a bull market.
However, June 2022 represented the lowest overall crypto market cap in more than 12 months. Bitcoin dominance was down due to investors running away from digital assets, not because they were buying other cryptocurrencies.
Factors That Influence Bitcoin Dominance
Bitcoin dominance is a metric that simply measures the value of existing Bitcoins in the market relative to the overall crypto market cap. As such, it is highly influenced by several factors including the following.
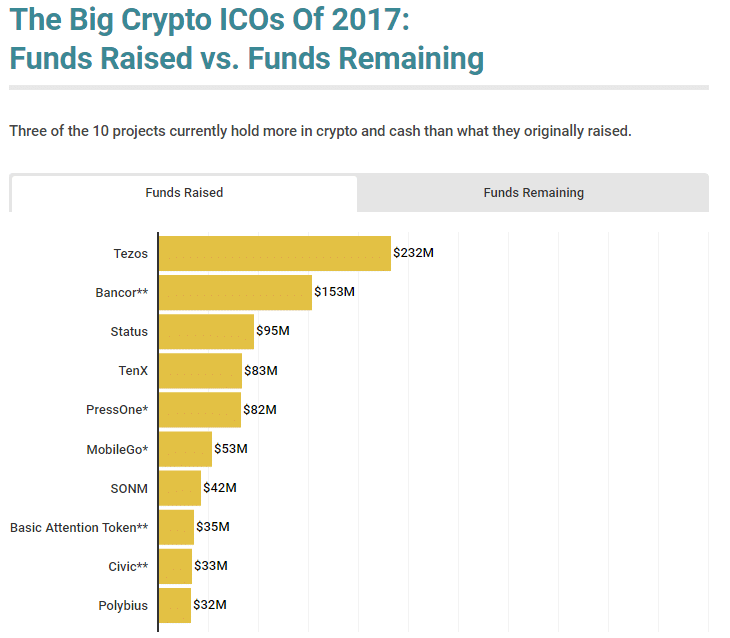
Altcoins and ICOs
A major factor in a decreasing trend in Bitcoin dominance is Initial Coin Offerings (ICOs), which came into vogue in 2017. Companies and startups with coding experience began leveraging the world of decentralized finance that Ethereum had ushered in. As new digital currencies were being released, investor buying confidence was high. However, the high volatility of the cryptocurrency market was unsustainable. By mid-2018, Bitcoin dominance returned to the 60s and many of the assets released by ICOs were sold off.
Bitcoin’s Price
Bitcoin has a max supply of 21,000,000 BTC, of which approximately 91% of Bitcoin's are already mined and in circulation. The number of BTC in the market is close to reaching its peak and has been stable for years. This means the biggest factor in Bitcoin’s market cap comes from its price. If the value of BTC decreases then so does its market cap. If its market cap decreases faster than the market cap of all other cryptocurrencies, then Bitcoin's dominance decreases.
Market Trends
The overall trend of the crypto market plays a major role in Bitcoin's dominance. The ICO trend in 2017–18 caused dominance levels to hit their lowest of all time. In addition, the NFT and DeFi sectors exploding in 2021 had a similar effect. Investors began moving their portfolios into NFT/DeFi-based tokens (such as Ethereum). For example, suppose the blockchain gains traction as a logistics and supply solution in the future. In that case, traders might start piling assets into crypto from this sector instead of BTC. Therefore, Bitcoin’s dominance would likely diminish.
Another trend affecting Bitcoin's dominance is whether the market is bearish or bullish. In the past, bull markets have indicated falling Bitcoin dominance as investors search for high-yielding altcoins.
On the flip side, bear markets have gone both ways. In these downtrends, traders often move their portfolios away from altcoins. Sometimes, they will use Bitcoin as a value store, increasing its dominance. On other occasions, investors will turn to stablecoins or even “recession-proof” assets in other industries like gold and defensive stocks. This results in low Bitcoin dominance despite a bear market, as traders have seen throughout the middle of 2022.
New Cryptocurrencies
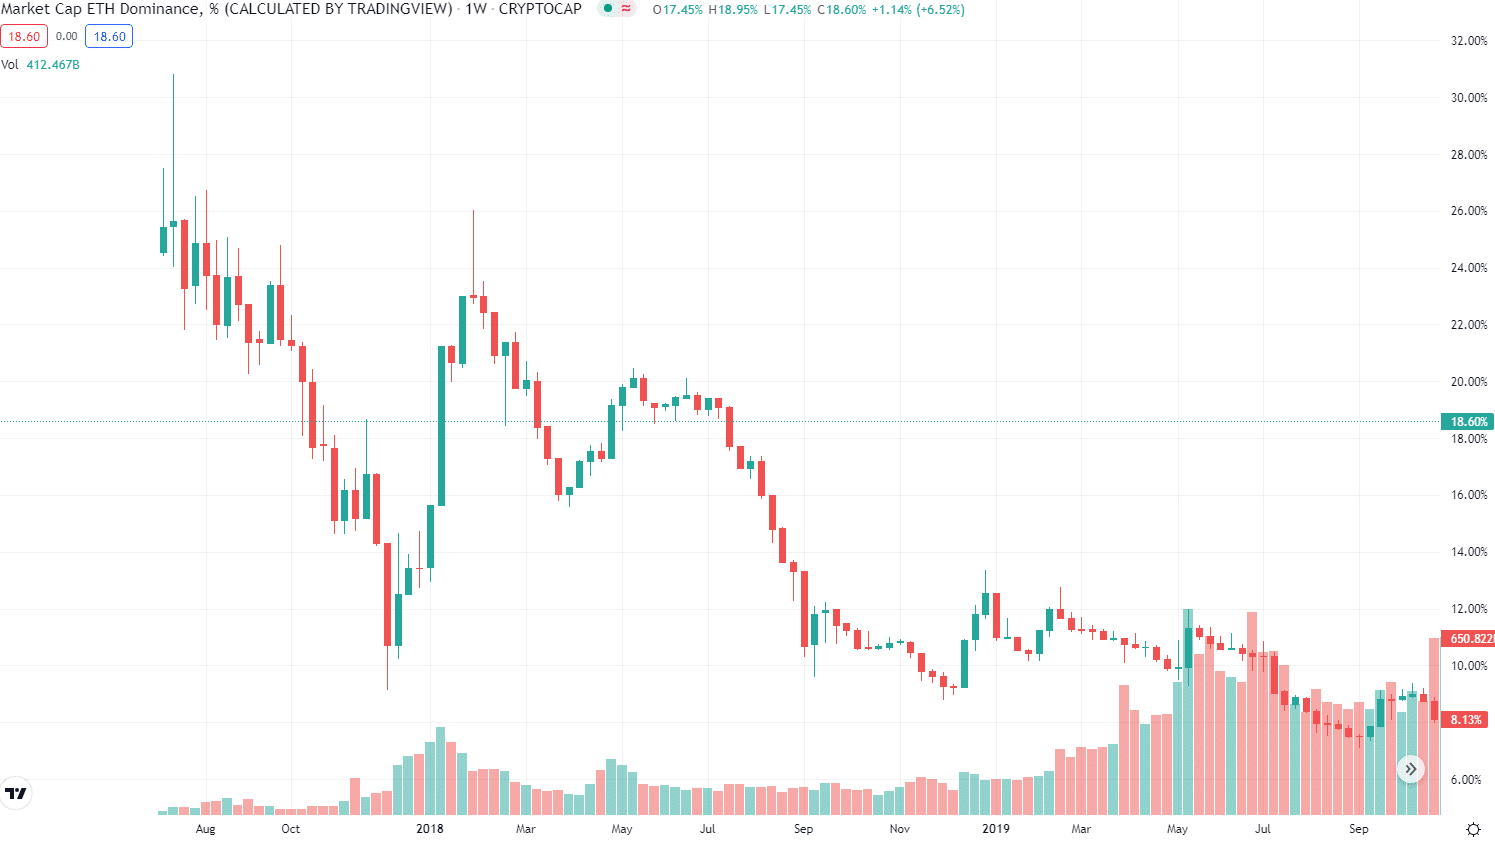
From time to time, newly-minted cryptocurrencies take the crypto market by storm and significantly affect Bitcoin's dominance. This is due to the addition of monetary value to the overall market cap. The emergence of big players like Ethereum, Binance Coin, and Solana has all made a mark on Bitcoin dominance.
This is a different factor to altcoins and the ICO bubble, as investors pour money into one or two assets instead of a diverse range of tokens. To date, Ethereum has gotten the closest, reaching a dominance percentage of around 25% in late 2017.
This Is How To Read The Bitcoin Dominance Chart
For even the most novice investors, Bitcoin dominance is an important concept to understand. However, the metric is also used by more experienced traders to determine market trends. On its own, Bitcoin dominance can be unreliable and provide false trading signals. However, when combined with further analysis, it can help investors make informed trading decisions.
1. BTC Dominance Can Indicate Rising Interest In Altcoins
The altcoins around Bitcoin heavily impact its proportion of the total market cap. A drop in Bitcoin dominance has historically signaled an incoming bull market for buying altcoins. This means traders can use the current trends in BTC dominance to determine if they should invest in Bitcoin or altcoins.
2. BTC Dominance vs BTC Price
Analyzing Bitcoin's dominance in tandem with its price can be a good way for people to interpret basic trading signals. Traders can use an umbrella set of principles to decide whether to buy or sell Bitcoin.
- If BTC dominance and BTC price are trending upward, this is typically a buy BTC indicator.
- If BTC dominance is trending upward, but BTC price is trending downward, this is typically a signal to sell altcoins.
- If BTC dominance is trending downward, but the price of BTC is rising, this may be a buy signal for altcoins.
- If BTC dominance and BTC price are trending downward, this is often interpreted as a sell signal for Bitcoin.
Related: How to sell Bitcoin into cash.
3. Spot Trend Reversals
BTC dominance can be used as an indicator of impending trend reversals. When Bitcoin dominance hits significant lows – like in early 2018 and mid-2022 – it helps establish a support level. Support levels are the point where a market downtrend has historically reversed. So, when Bitcoin dominance falls to these historic support levels, there’s a chance it will rebound and start trending upward.
On the other hand, when Bitcoin dominance hits its previous highs, they are known as resistance levels and can indicate an incoming downtrend. For example, on July 19, 2022, Bitcoin’s dominance percentage plummeted to 41%, its lowest point since April. However, it had hit a support level, and within a day, the momentum shifted. BTC dominance jumped 2% in a matter of hours.
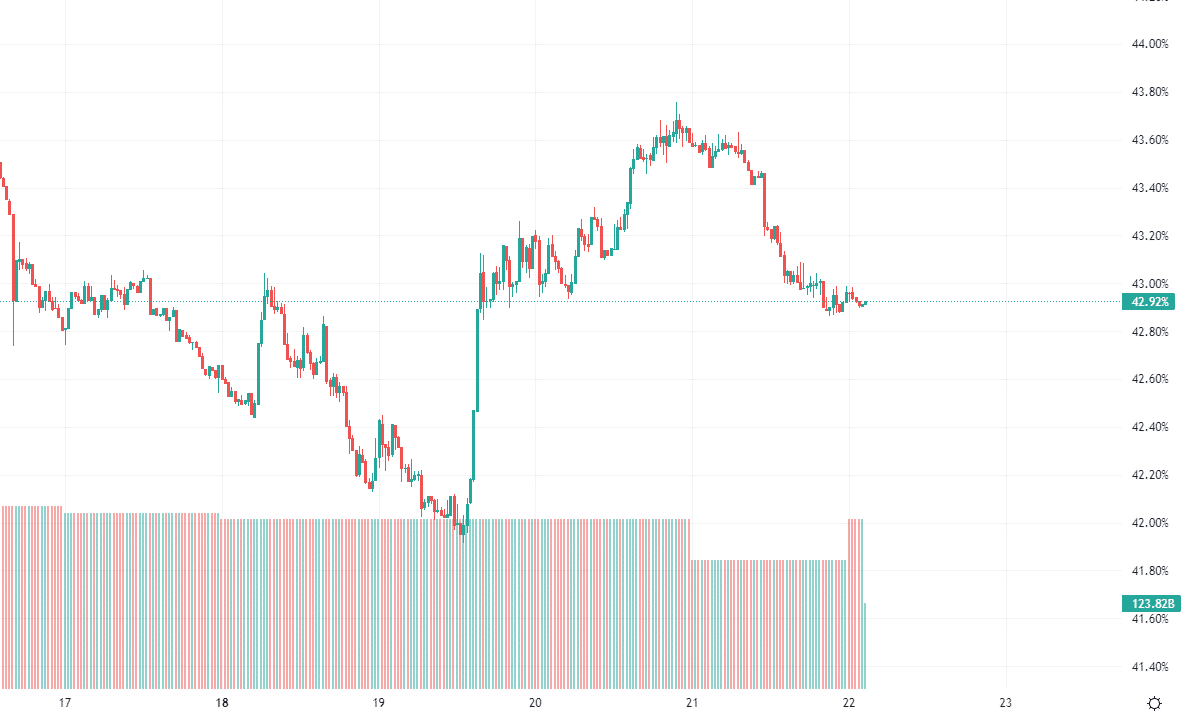
Over the next few days, Bitcoin’s price followed suit – rising in value by $2,000.
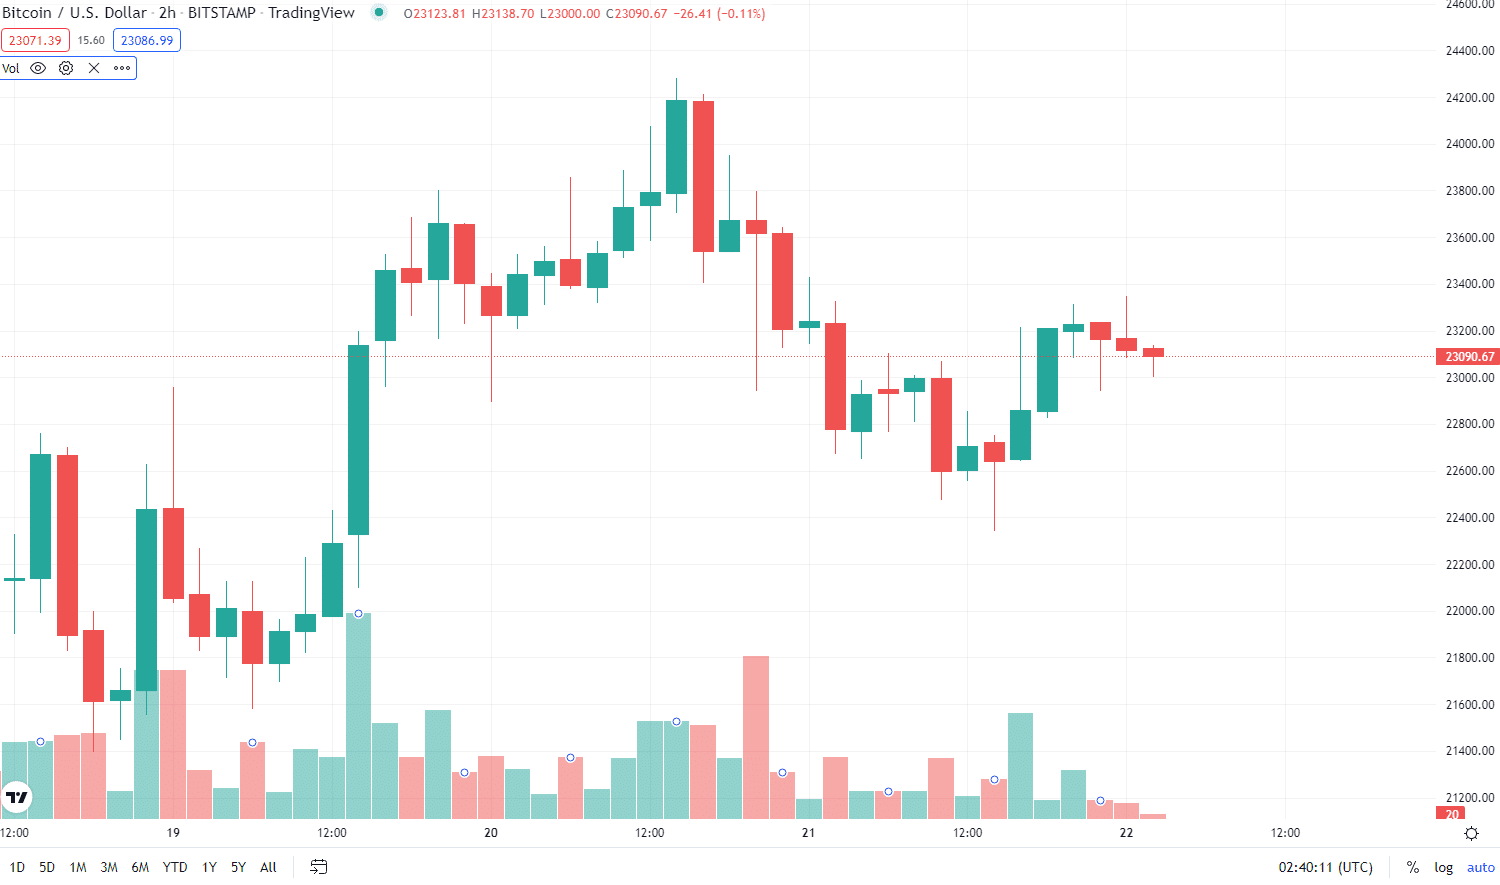
Swing traders that recognized the incoming trend reversal could’ve returned over 10% by buying Bitcoin at the bottom of its dominance ratio. However, trend reversals in Bitcoin dominance do not always mean an impending price rise. They should never be used as a sole trading signal.
Downsides Of Using Bitcoin Dominance
Bitcoin dominance is an important metric for investors to understand. It can help them grasp the current market situation and adjust their financial goals accordingly. However, BTC dominance has the same disadvantages as any other trading strategy or tool. Without context, it can be incredibly misleading. Relying on one technical analysis method to form trading positions is a surefire way to rack up significant losses.
The cryptocurrency market is extremely complex and constantly evolving. BTC dominance analysis relies on previous trends to form opinions on future market movements. This is a flawed strategy, as altcoins have only recently begun to saturate the cryptocurrency world. Therefore, the data used in BTC dominance can’t reliably predict trends.
For example, if hundreds of new altcoins grow exponentially in market cap, the Bitcoin dominance ratio would dilute. Say the index eventually stabilized at a percentage of 10 – suddenly, all previous data is without precedent and nearly useless. The bottom line? Be very careful when using BTC dominance to inform investment decisions.
You might also be interested in

Updated Dec 19th, 2025
What Is Dollar Cost Averaging (DCA) In Crypto?

Updated Dec 19th, 2025
Crypto Fear & Greed Index: This Is How To Use It

Updated Dec 19th, 2025
Expect This To Happen To Bitcoin’s Price If The Stock Market Crashed

Updated Dec 19th, 2025
This Is How You Use Volume When Trading Crypto
Kevin Groves
Kevin started in the cryptocurrency space in 2016 and began investing in Bitcoin before exclusively trading digital currencies on various brokers, exchanges and trading platforms. He started Hedge With Crypto to publish informative guides about Bitcoin and share his experiences with using a variety of crypto exchanges around the world.