We may earn a commission from links on our site, but this doesn’t affect our reviews. Learn more.
Hedge With Crypto is an independent publisher that provides objective and free content. Articles on our site may include links to our partners. If you click on these links, we may earn a commission. However, our editorial content remains unbiased, reflecting our own opinions or the general information available. For more information on our company policies, read the Affiliate Disclosure, Privacy Policy, and Terms & Conditions.
How To Use RSI In Crypto: 7 Steps To Trade The RSI Indicator
The RSI indicator can be a powerful tool for a crypto trader. Find out how to use RSI when trading crypto for the best results.
Hedge With Crypto aims to publish information that is factual and accurate as of the date of publication. For specific information about a cryptocurrency exchange or trading platform please visit that provider’s website. This information is general in nature and is for education purposes only. Hedge With Crypto does not provide financial advice nor does it take into account your personal financial situation. We encourage you to seek financial advice from an independent financial advisor where appropriate and make your own enquiries.
TABLE OF CONTENTS
Traders employ countless techniques to make the most of the markets, each with varying levels of popularity. Perhaps the most popular strategy is using technical analysis (TA) by visualizing trends on a live-updating chart. Combining the price action of a digital currency with a technical indicator like the RSI can be an effective method for finding buy and sell opportunities in the crypto market. But what exactly is the RSI, how can it be used, and what are its benefits and downsides?
Featured Partner
Kraken
Best Exchange To Buy Bitcoin
4.8 out of 5.0
Kraken is a top-rated and regulated exchange best known for its safety and multiple methods to buy Bitcoin and crypto worldwide.
222
USD, GBP, EUR, CAD, CHF, JPY & AUD
Bank transfer, SWIFT, SEPA, debit and credit card
0.16% (maker) and 0.26% (taker)
How To Trade Crypto With The RSI Indicator
1. Open the crypto charts
When it comes to technical analysis trading, the first step is to find crypto charting software or a cryptocurrency exchange that supports indicators. One of the best available is TradingView which supports thousands of crypto trading pairs across multiple exchanges in one location. The free plan can be used to overlay the RSI indicator. There are alternative charting software available and most cryptocurrency exchanges integrate with TradingView which this tutorial will be based on.
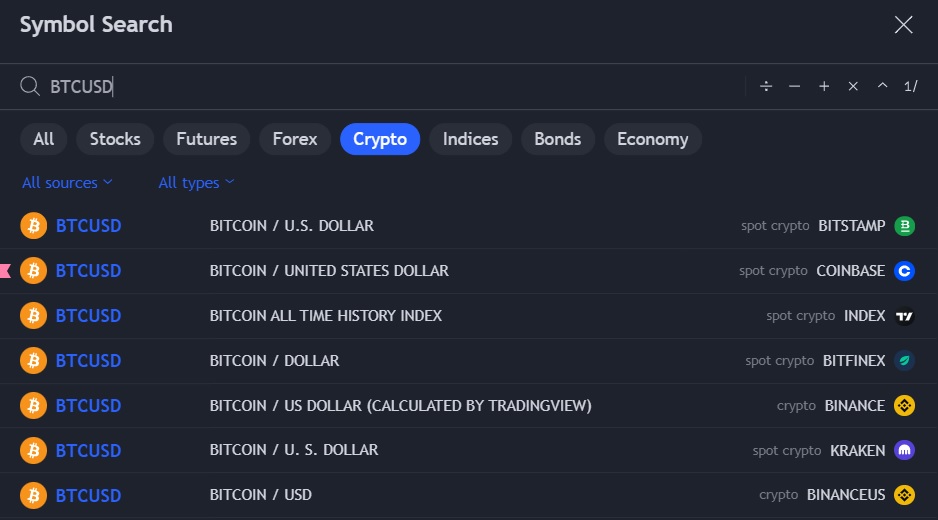
2. Find and select the cryptocurrency trading pair
Once the account has been created, navigate to the ‘Symbol Search” to find a crypto pair to trade. There is a filter along the top to narrow down the selection to ‘crypto' only pairs. Make a selection such as Bitcoin/USDT which will bring up the price chart. It is important to note that the prices differ on each exchange, so it's recommended to open the pair price chart on the same exchange as the trading account. For example, those with a ByBit account should click on the “BTC/USDT” or “BTC/USDT.P” for leverage trading on ByBit.
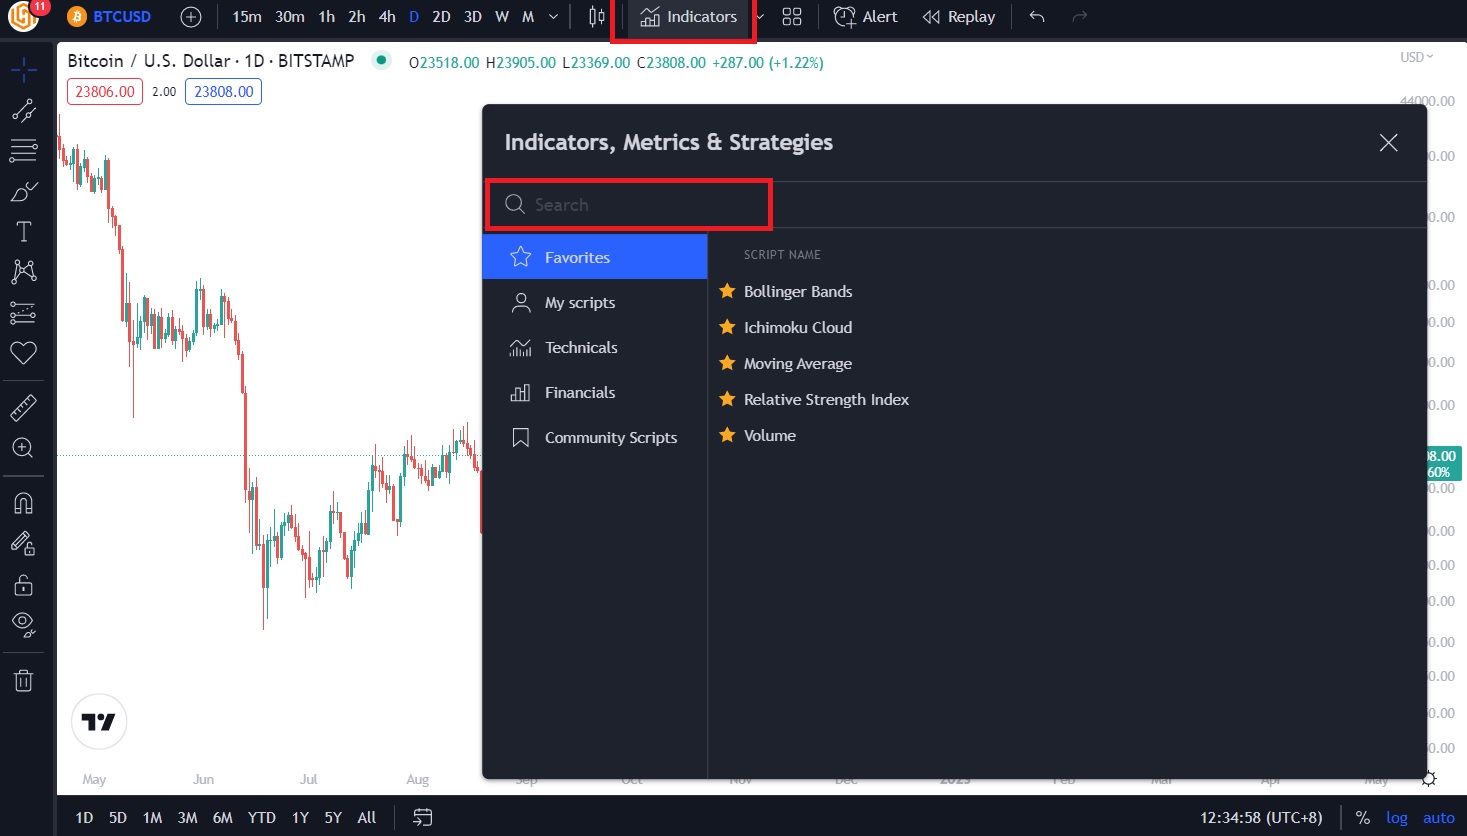
3. Find and add the RSI indicator
Now the desired chart is open, click the “Indicators” button from above the graph. This will open a pop-up box with a search bar. Search for “RSI” and select the relevant indicator. Just clicking the indicator’s name will add it to the chart.
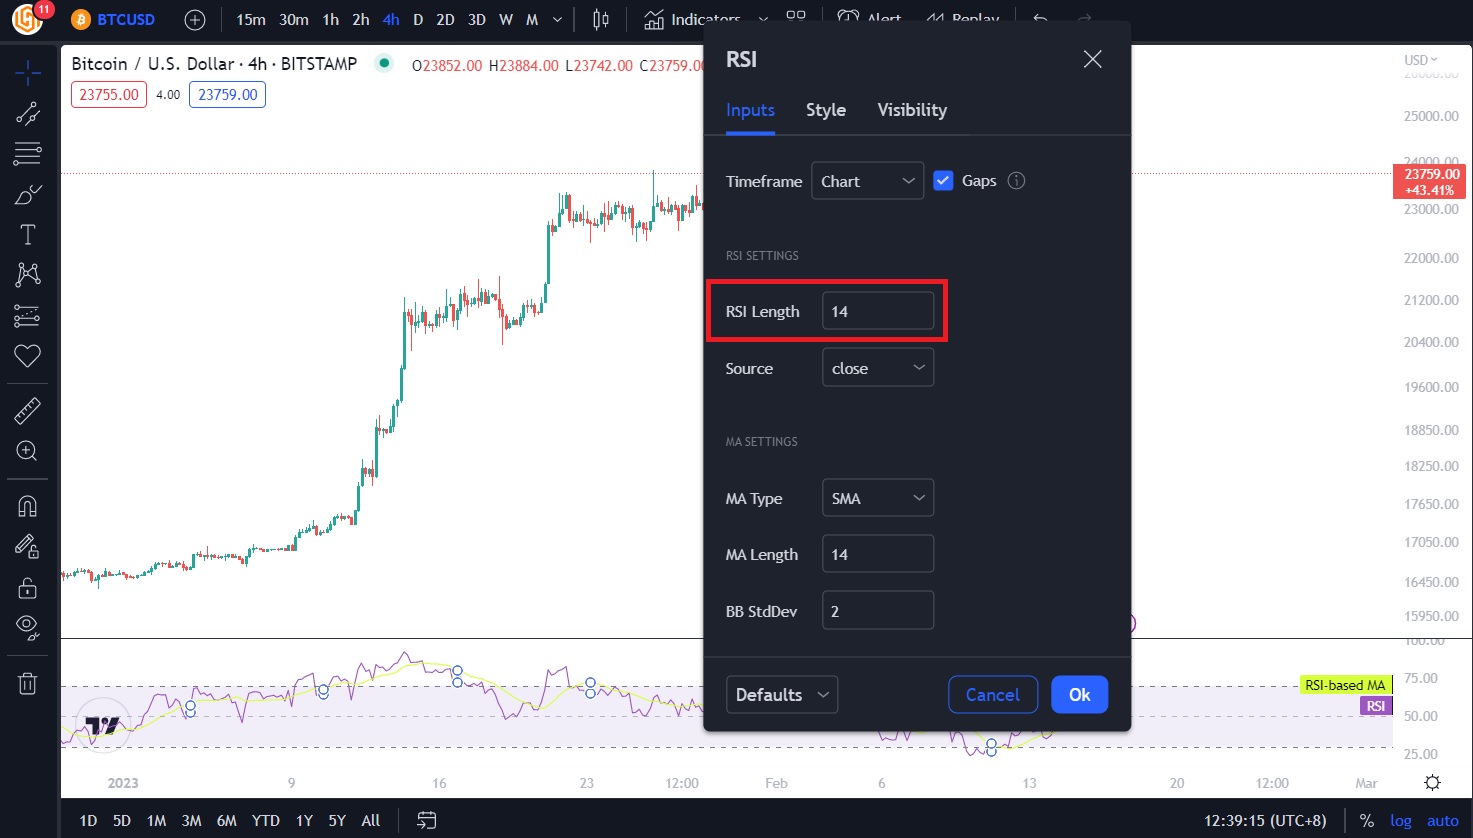
4. Confirm RSI and chart settings
By default, the RSI is set to incorporate data from the past 14 periods. This can be adjusted by clicking the “gear icon” in the top left of the RSI graph. Shorter periods are good for day traders. Next, adjust the price chart’s settings to suit an investment strategy. Periods of 1 day, 5 days, 1 month, 3 months, 6 months, 1 year, and 5 years can be found in the bottom left of the platform, underneath the RSI graph. Click on the desired period to adjust the chart. For those starting out, the default RSI settings are recommended.
5. Use the RSI indicator to determine overbought and oversold conditions
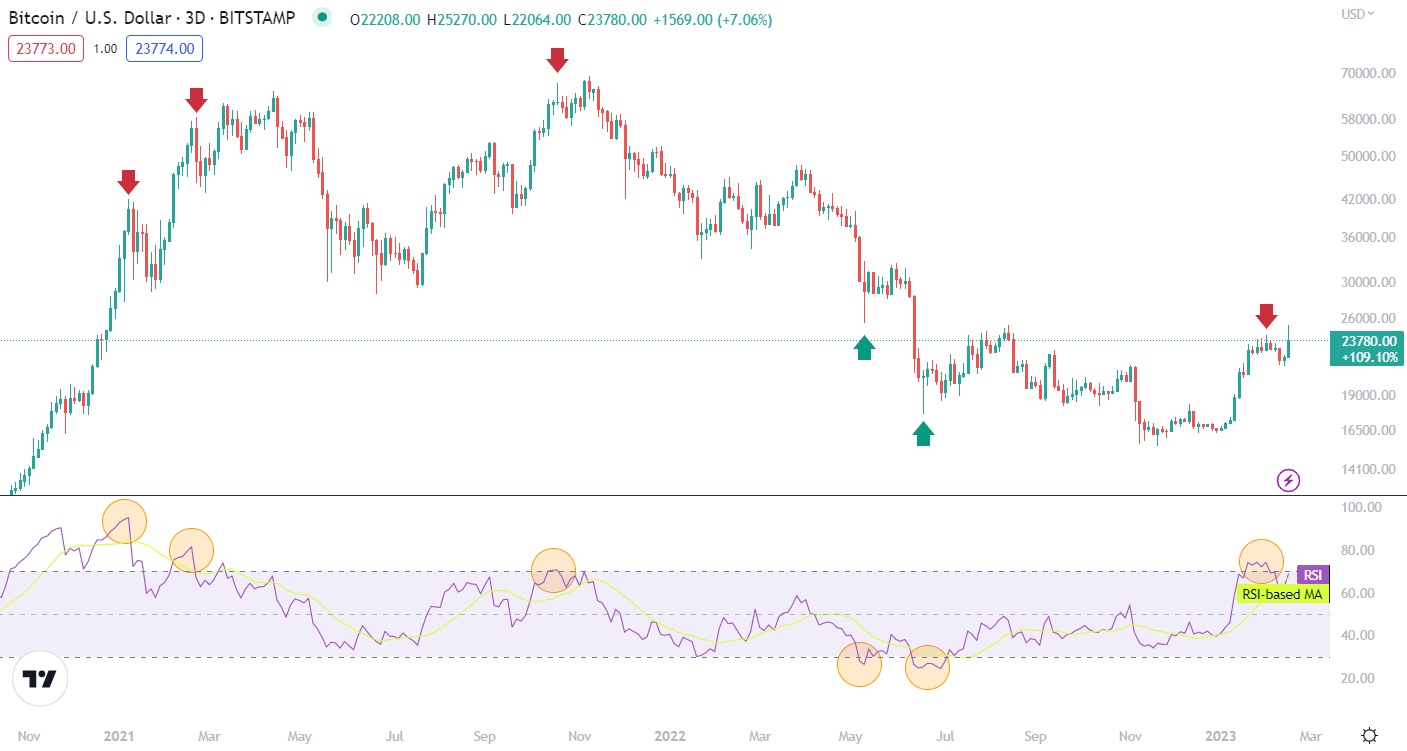
The RSI indicator’s easiest use case is to determine when a coin is overbought or oversold. At a base level, this occurs when the RSI reads over 70 (overbought) or under 30 (oversold) on default settings. Such readings are considered soft buy and sell signals. For a more acute soft signal, the RSI configuration can be changed to 80 (overbought) and 20 (undersold).
If the RSI indicator starts to make higher highs (or lower lows), this is an additional confirmation signal for the change of trend direction.
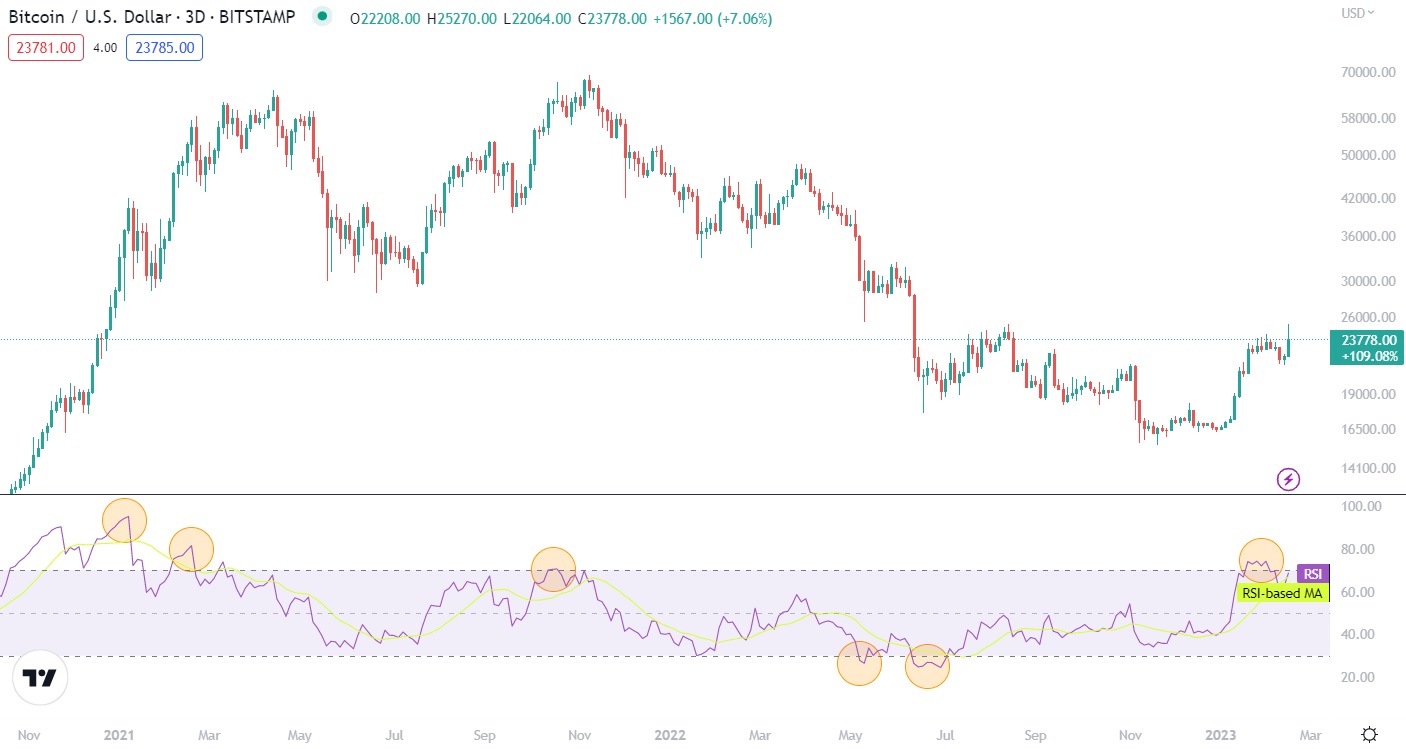
6. Identify potential entry and exit points
The RSI can be used to identify opportunities to buy and sell a particular asset when the indicator is in the “overbought” and “oversold” areas. When combined with another trading signal or strategy, the trading concept is to look to buy when the RSI is below 30 (oversold) and sell when the RSI is above 70 (overbought) conditions. The RSI indicator should not be used as the sole trading signal, but to complement a broader trading strategy.
7. Place orders according to the RSI strategy
Part of a solid trading strategy involves risk mitigation. Investors should set up stop losses and take profit levels to ensure that emotions like fear and greed don’t lead them to abandon their plans. Now that potential entry/exit points have been identified and risk mitigation is in place, it’s time to begin trading using the RSI.
There are various ways to trade crypto using technical analysis for short-term and long-term trading. In this case, the swing high (overbought) and swing low (oversold) at RSI levels of 30 and 70 is one area to place a stop loss order. Once the parameters of the trade are confirmed using the RSI indicator as confluence, the last step is to place an order (limit) or market buy/sell at current prices.
What Is The Relative Strength Index (RSI)?
The Relative Strength Index (RSI) is a crypto indicator that was invented in 1978 by J. Welles Wilder Jr. The RSI can be added to any crypto’s price chart. It is a single-point graph that will deliver a score between 0 and 100. In layman's terms, an RSI score of under 30 is considered oversold and suggests the price of an asset may swing upwards. Conversely, a score of over 70 indicates overbought conditions and is used to identify a potential sell opportunity.
The RSI is one of the most-used crypto technical indicators known as momentum indicators. Momentum indicators aren't used to determine a cryptocurrency's price trends, but rather, the rate at which a trend is moving.
RSI Indicator Pros:
- Very easy to implement, use and read
- Can help identify shifts in momentum
- Makes for an excellent pairing with the MACD indicator
RSI Indicator Cons:
- Is less reliable in already-trending markets
- Shouldn’t be used on its own
- Doesn’t provide context on why conditions may be oversold or overbought
How Does The RSI Work?
The RSI is based on a formula to identify when a crypto market is “overbought” and “oversold” based on the current and historical strength or weakness. The oscillator measures the velocity, magnitude, and direction of price movement. It is calculated using a mathematical formula that compares the magnitude of recent gains and losses. The formula to calculate RSI is below:
RSI formula = 100 – (100/[1+(Average Upward Price Change/Average Downward Price Change])
Put simply, the equation measures the size and frequency of recent price movements. It compares the strength of price action during a crypto asset's positive days to its down days. That way, investors can identify the prevailing trends of a coin and how strong (or weak) they are.
Different Ways To Trade RSI In Crypto
The RSI can be used to identify when a digital currency is overvalued or undervalued based on the speed and volatility of its recent price movements. This might indicate that the momentum of a trend is starting to lose momentum, or that a reversal in price direction is looming. For example, a trader might sell an asset when its RSI reaches 70+, or buy more of a coin if its reading falls below 30. The RSI can identify more intricate buy/sell signals through divergences, support, and resistance levels, and swing failures.
During Trending Markets
The RSI can be used in trending markets (those that regularly make new support and resistance levels) but is less reliable and requires a different level of analysis. This is because an RSI reading can suggest overbought market conditions even while an asset is in a sustained uptrend. The inverse is also true.
During an uptrend, oversold conditions are much higher than 30 – sometimes as high as 90. Conversely, a downtrend's RSI reading usually ranges between 10 and 60. So during trending markets, a strategy is to use the RSI's midpoint as a very loose support and resistance indicator, rather than the typical RSI value of 30/70 readings.
RSI Divergences
Bullish or bearish divergence is one of the most commonly-used RSI crypto trading signals. The principle here is simple – when the RSI reading moves in the opposite direction to the price of an asset, it suggests a potential shift in price action. There are two basic divergences to look out for – bullish and bearish.
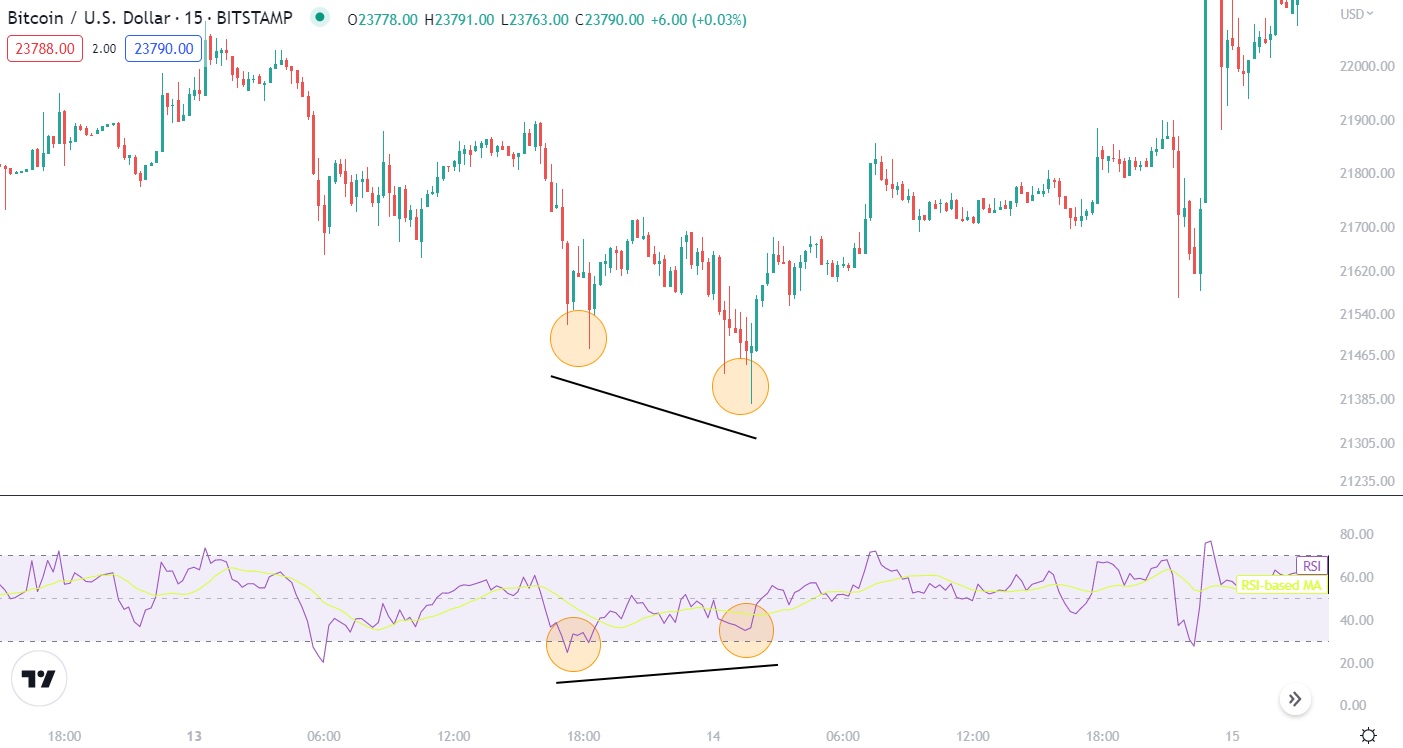
Bullish RSI divergences
A bullish divergence can be spotted when the RSI is plotting higher lows while a coin's price is making lower lows. Even though the price chart may show the asset is trending downwards, the RSI indicates that bullish momentum is brewing and the trend might flip. A trader may interpret this as a suitable entry point to go long on a cryptocurrency.
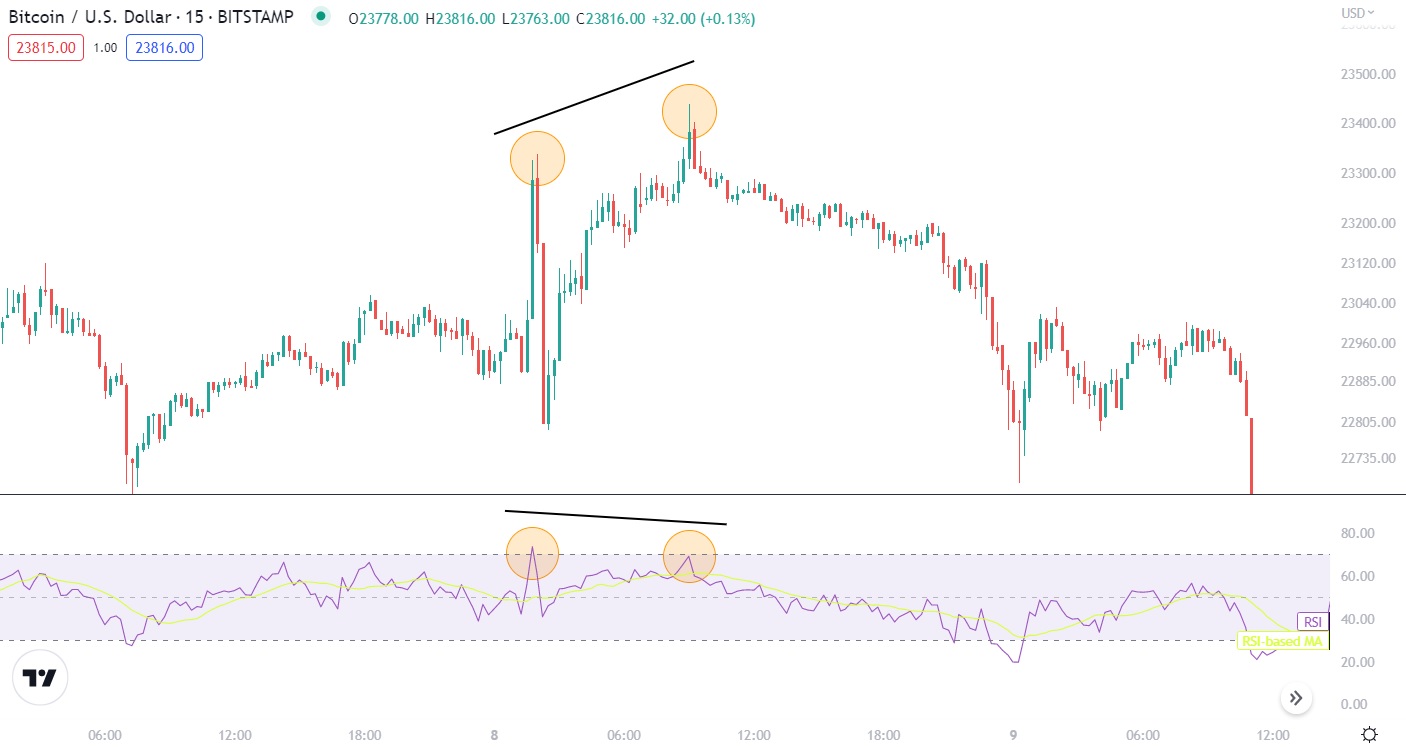
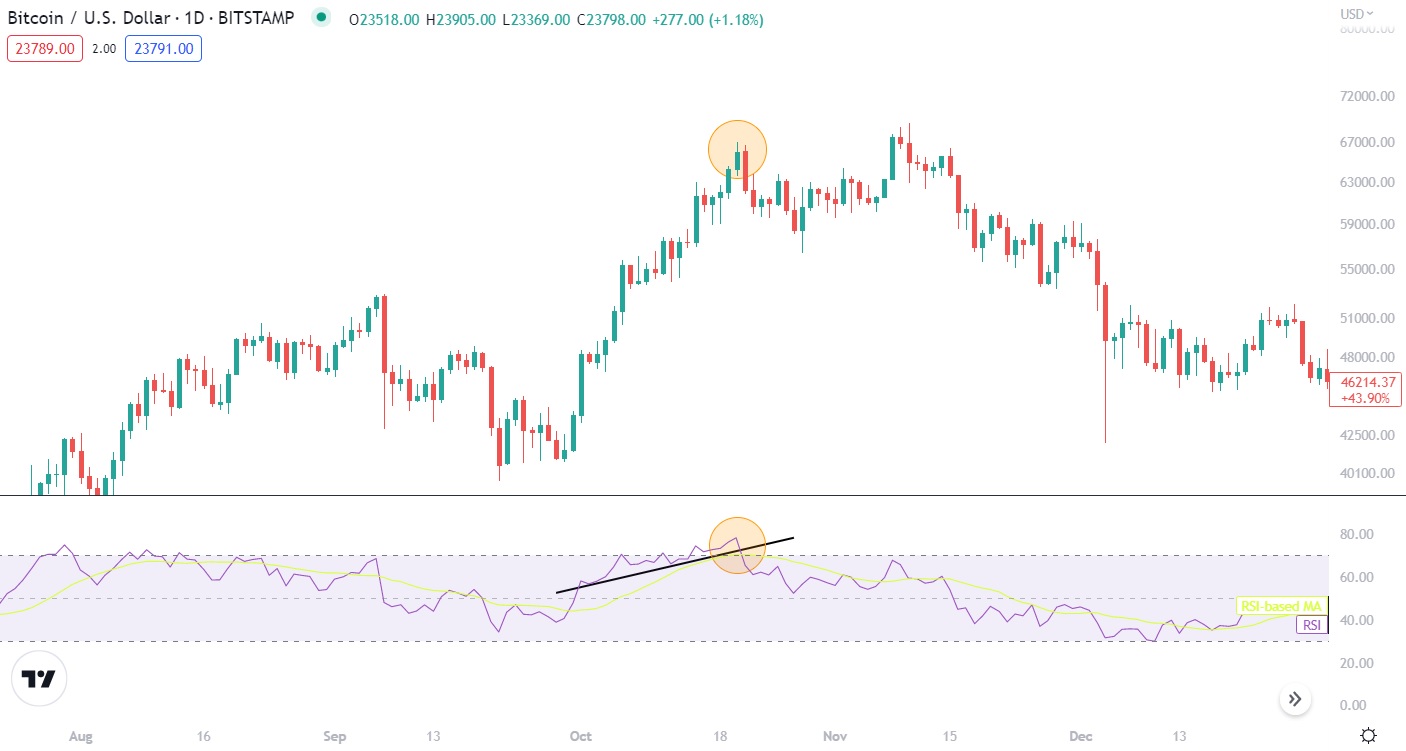
Bearish RSI divergences
A bearish divergence is exactly the same, except reversed. It can be identified when the RSI's high points fall in succession while the crypto's price continues to hit higher peaks. This indicator tends to suggest an asset is overbought, its momentum is slowing, and a bearish trend may be imminent. This might prompt a trader to go short (or sell) a cryptocurrency, even while it is trending upward in the short term.
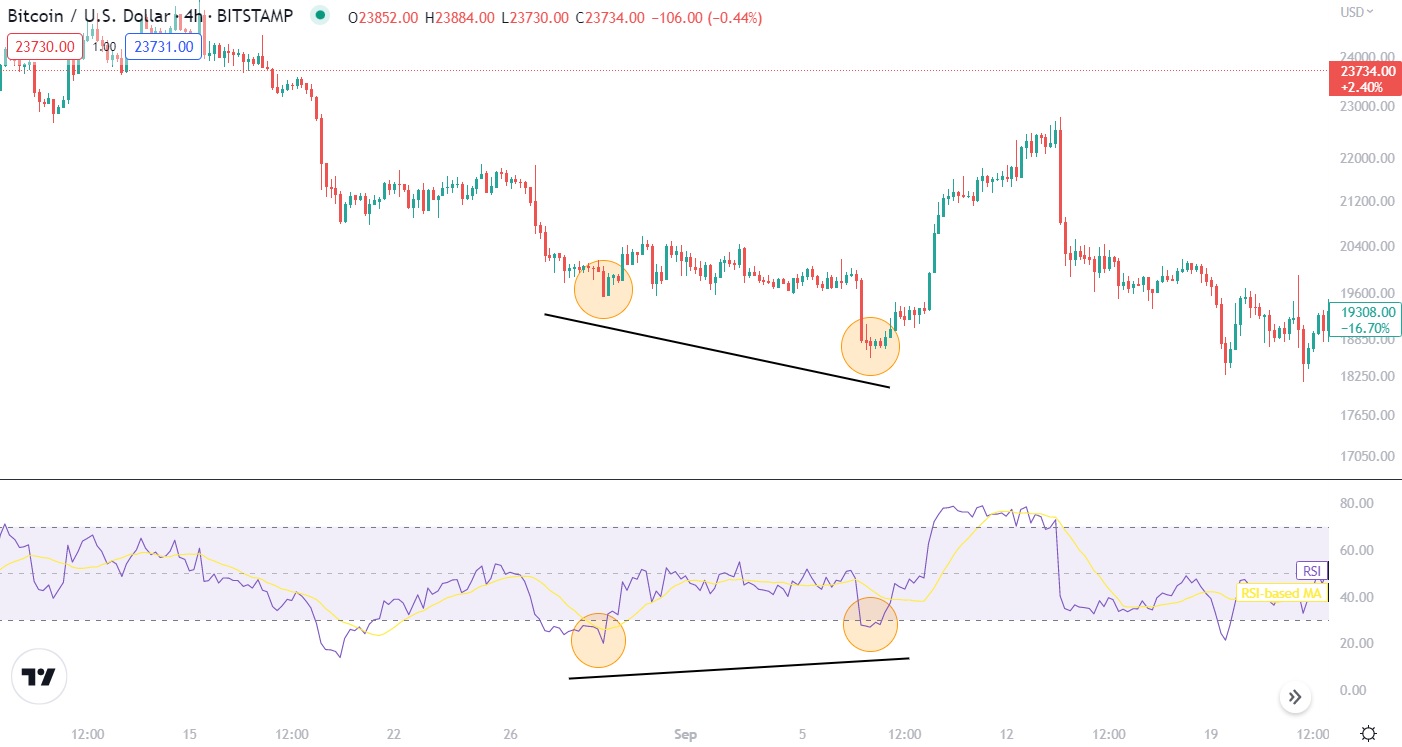
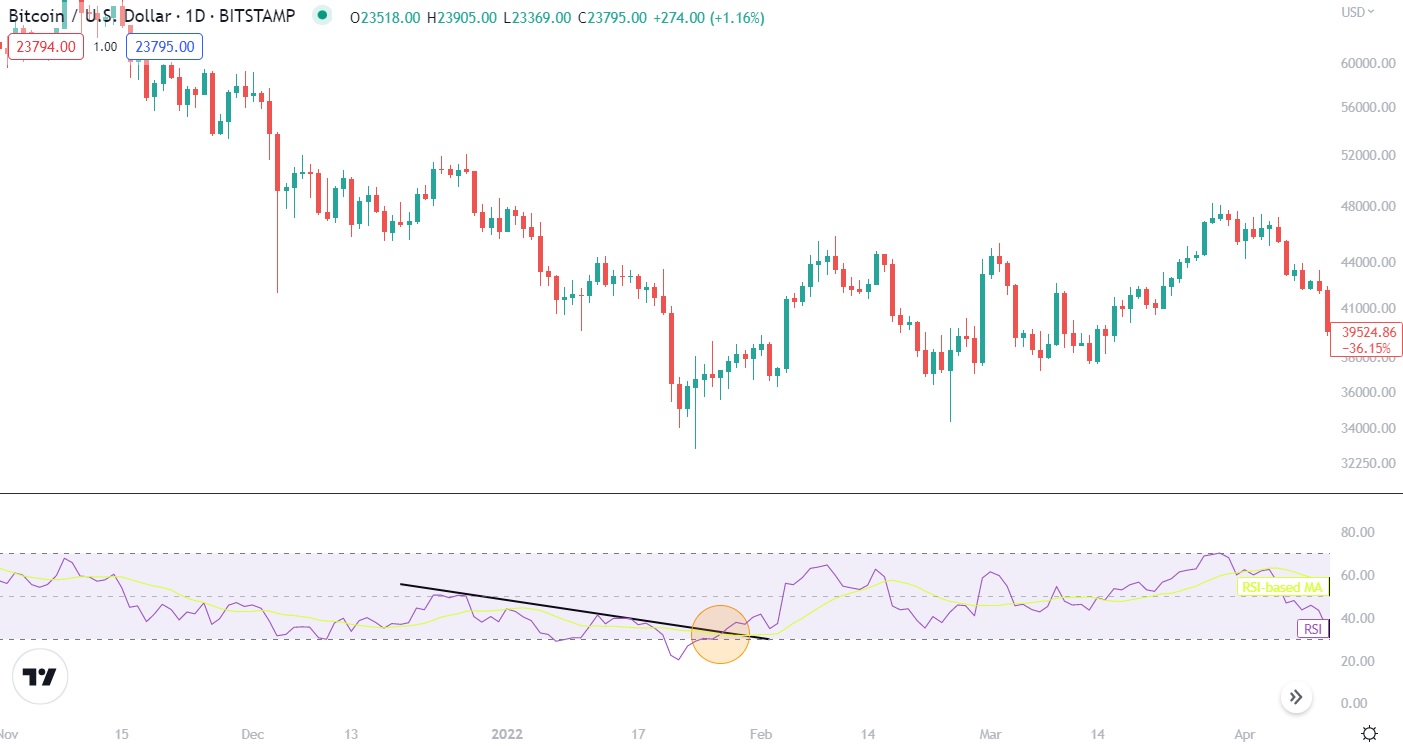
Hidden RSI divergences
One of the best ways to trade the RSI indicator is to identify “hidden divergence”. It is a more advanced crypto trading signal using the RSI indicator to spot a potential reversal in prices. This is visualized when the trend line on the RSI oscillator is moving in the opposite direction to price action and works for both bullish and bearish scenarios. In the bullish case, if the price of Bitcoin is declining but the RSI is making higher lows, then it can signify a reversal is imminent. An example of bullish hidden divergence is shown below.
RSI Breakouts
As the RSI indicator is a single-point oscillator, it can easily be used to draw trendlines. Trendlines occur when a straight line can be drawn that is touched by the RSI's graph three or more times. The more often the RSI touches the trendline, the stronger the trend. The RSI breaking out of the trendline (by rising above or falling below) can indicate a potential shift in momentum.
An RSI breakout can sometimes precede a price breakout by days (or even weeks), making it a leading signal that can be used to get ahead of the market. This analysis method is best paired with an RSI duration of 14 periods or higher. However, remember that predictive indicators can be unreliable and that not every trend breakout will result in synonymous price action.
Failure Swings
Failure swings are a similar buy/sell signal to divergences, with a few key differences. This indicator can be easily identified by its “M” or “W” shape on the RSI graph. They are most effectively used during an up (M) or downtrend (W) and occur when the RSI does not follow the price action making higher highs or lower lows.
To test for a buy or sell signal, traders should identify support and resistance levels (fail points) of an RSI's reading. If the tail of the “M” or W” breaks above (or below) the RSI's fail point, this can suggest an imminent trend reversal.
“Failure swings above 70 or below 30 are very strong indications of market reversal” – Welles Wilder Jr., creator of the RSI.
Benefits of Using the RSI Indicator
- Simple to implement. It doesn't take an experienced crypto trader to use the RSI indicator at a basic level. The overbought and oversold levels of RSI are very clearly marked, so even beginners can perform entry-level analysis to spot potential reversal areas on the charts.
- Basic mathematical formula. Some indicators have complex math backing them. The RSI indicator, however, is easy enough to understand and can even be calculated by hand.
- Versatility. The RSI can be used as both a leading and lagging indicator and can be effective in both trending and sideways markets. Although it is more reliable during ranging markets.
- Easily identifiable signals. The RSI indicator can give consistent crypto trading signals to support an overall strategy, particularly when combined with Fibonacci retracement levels. Therefore, traders can find many potential entry and exit opportunities for various crypto tokens.
- Paired with charting patterns. The RSI indicator can be used as the confirmation signal to enter a long or short position based on a crypto chart pattern. For example, waiting for RSI divergence at a double top or bottom can potentially increase the win rate percentage.
Downsides of Using the RSI Indicator
- RSI isn't always reliable. No indicator is 100% reliable and the RSI should never be used as a sole crypto trading signal. The RSI can help identify momentum and potentially overbought/oversold market conditions but doesn't provide any context as to why.
- Less effective during trending markets. The RSI indicator can identify signals during trending markets but is also more prone to feeding false trading signals during such periods. For example, the RSI can read over 70 for weeks even while an asset's price rises.
- No trend reversal timelines. Although the RSI can be a great way to identify shifts in momentum, it doesn't give traders many indications of when these price reversals might occur. This isn't a huge issue for longer-term investors, but such a limitation can seriously hamper day traders.
Indicators To Pair With The RSI
It is highly recommended to pair the RSI with another indicator. Not only is the RSI unreliable as a sole indicator, but using multiple analysis tools will help traders see the bigger picture of a cryptocurrency's price trends.
Moving Average Convergence Divergence (MACD)
Perhaps the most common indicator pairing is the RSI with the MACD. The MACD is another momentum indicator that compares an asset's long and short-term moving averages. The MACD indicator can be a good way for traders to confirm buy/sell signals they've identified on an RSI chart.
For example, let's say an investor recognizes a bearish divergence on their RSI graph. They could then use the MACD to determine if the moving averages are also diverging from the price action. If so, this is a stronger sell signal than using the RSI indicator in isolation.
Exponential Moving Average (EMA)
The EMA also compares the short-term and long-term moving averages of a crypto's price. When investors utilize the EMA, they are on the lookout for crossovers – when one of the two moving average lines breaches the other. The RSI can identify potential shifts in momentum, but it is limited in informing traders when this might actually occur.
Related: When is the best time to trade crypto?
As the EMA emphasizes recent price action, it can help confirm RSI signals. The EMA's settings are best configured to analyze shorter durations, such as 5 and 10 days. In this instance, if the 5-day EMA crosses above the 10-day EMA, while the RSI is reading below 30, this could be interpreted as a strong buy signal.
Bollinger bands
Bollinger Bands is an extremely simple crypto trading strategy that is actually rather reliable and effective. This is because the vast majority of price action will occur within the bands. RSI can be used to identify divergence or hidden divergence at the extremities of the upper/lower bands. When the price action of a crypto pair returns back within the bands with RSI confirmation, this is can be interpreted as a strong buy or sell signal.
Frequently Asked Questions
Does RSI Work For Crypto?
Yes, the Relative Strength Index is a versatile indicator that can work with the crypto markets, as well as traditional markets such as stocks and forex.
What is the best time period for RSI indicator?
Most traders will find the RSI’s default 14-period timeframe to be adequate for their strategies. However, day traders may want to consider changing the duration to between 2 and 6.
Kevin Groves
Kevin started in the cryptocurrency space in 2016 and began investing in Bitcoin before exclusively trading digital currencies on various brokers, exchanges and trading platforms. He started Hedge With Crypto to publish informative guides about Bitcoin and share his experiences with using a variety of crypto exchanges around the world.