We may earn a commission from links on our site, but this doesn’t affect our reviews. Learn more.
Hedge With Crypto is an independent publisher that provides objective and free content. Articles on our site may include links to our partners. If you click on these links, we may earn a commission. However, our editorial content remains unbiased, reflecting our own opinions or the general information available. For more information on our company policies, read the Affiliate Disclosure, Privacy Policy, and Terms & Conditions.
11 Best Crypto Chart Patterns
There are several trading patterns that crypto investors should look out for when implementing a successful strategy. Understanding how to identify trading patterns can go a long way. Here’s a selection of the most popular crypto chart patterns to trade.
This information is general in nature and is for educational purposes only. Hedge With Crypto does not provide financial advice nor does it take into account your personal financial situation. We encourage you to seek financial advice from an independent financial advisor where appropriate and make your own enquiries.
TABLE OF CONTENTS
Most successful crypto traders use a combination of technical analysis and fundamental analysis to maximize their potential profits. While reading chart patterns may seem daunting for crypto newcomers, they are integral to any good trading strategy. This guide will dive into some of the best crypto chart patterns that can be used by experienced traders and beginners alike.
Best Crypto Chart Patterns To Trade
- Head and shoulders pattern
- Ascending and descending triangle pattern
- Bullish and bearish flag patterns
- Rectangle channels
- Ascending and descending channels
- Rising and falling wedge pattern
- Bullish and bearish pennant pattern
- Double/triple top and bottom patterns
- Cup and handle pattern
- Rounded bottom and top pattern
- Swing failure top and bottom pattern
Featured Partner
Kraken
Best Exchange To Buy Bitcoin
4.8 out of 5.0
Kraken is a top-rated and regulated exchange best known for its safety and multiple methods to buy Bitcoin and crypto worldwide.
222
USD, GBP, EUR, CAD, CHF, JPY & AUD
Bank transfer, SWIFT, SEPA, debit and credit card
0.16% (maker) and 0.26% (taker)
Most Profitable Crypto Patterns Compared
| Chart Pattern | Type of Strategy | Suitable For | Estimated Success Rate |
|---|---|---|---|
| Head And Shoulders | Reversal | Beginners | 80% |
| Ascending And Descending Triangle | Continuation | Intermediate | 70% |
| Bullish And Bearish Flag | Continuation | Intermediate | 65% |
| Rectangle Channels | Continuation | Beginners | 80% |
| Ascending And Descending Channels | Continuation | Intermediate | 70% |
| Rising And Falling Wedge | Reversal and continuation | Intermediate | 66% |
| Bullish And Bearish Pennant | Reversal | Experienced | 55% |
| Double/Triple Top And Bottom | Reversal | Beginner | 80% |
| Cup And Handle | Continuation | Intermediate | 65% |
| Rounded Bottom And Top | Reversal | Intermediate | 60% |
| Swing Failure Top And Bottom | Ranging and reversal | Experienced | 50% |
* Note that these figures tend to come from longer-term swing traders with ample experience. Beginners, especially day traders, using these chart patterns should expect success rates of 50% or lower. Read our methodology is how these figures were estimated.
Popular Crypto Chart Patterns Explained
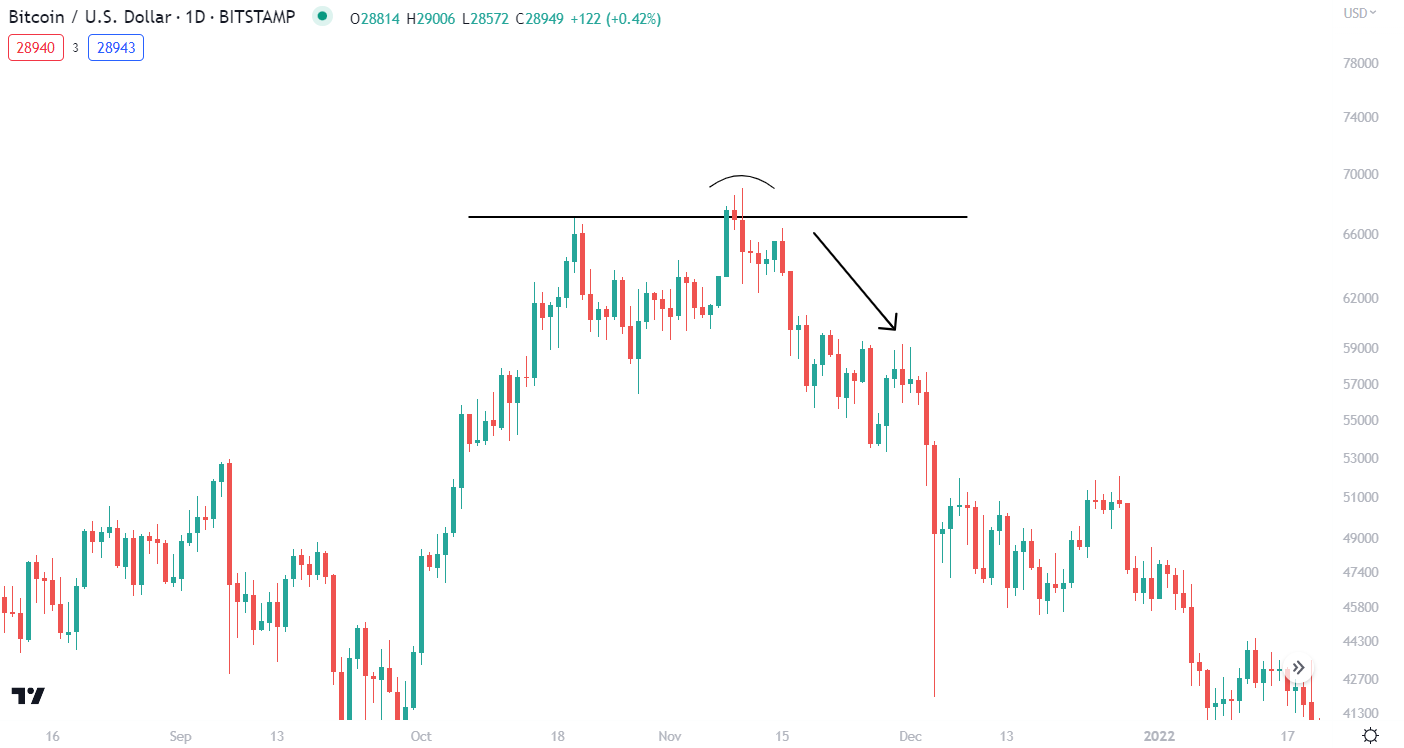
1. Head And Shoulders
The head and shoulders chart pattern is one of the easiest crypto trading signals to identify and is one of the most popular forms of technical analysis. It can be effective in all types of market conditions. Traders estimate the head and shoulders pattern to have a strike rate of nearly 80%, which makes it an excellent choice for beginners just dipping their toes into charting. The success rate can be realized when paired with popular crypto indicators such as the RSI or MACD.
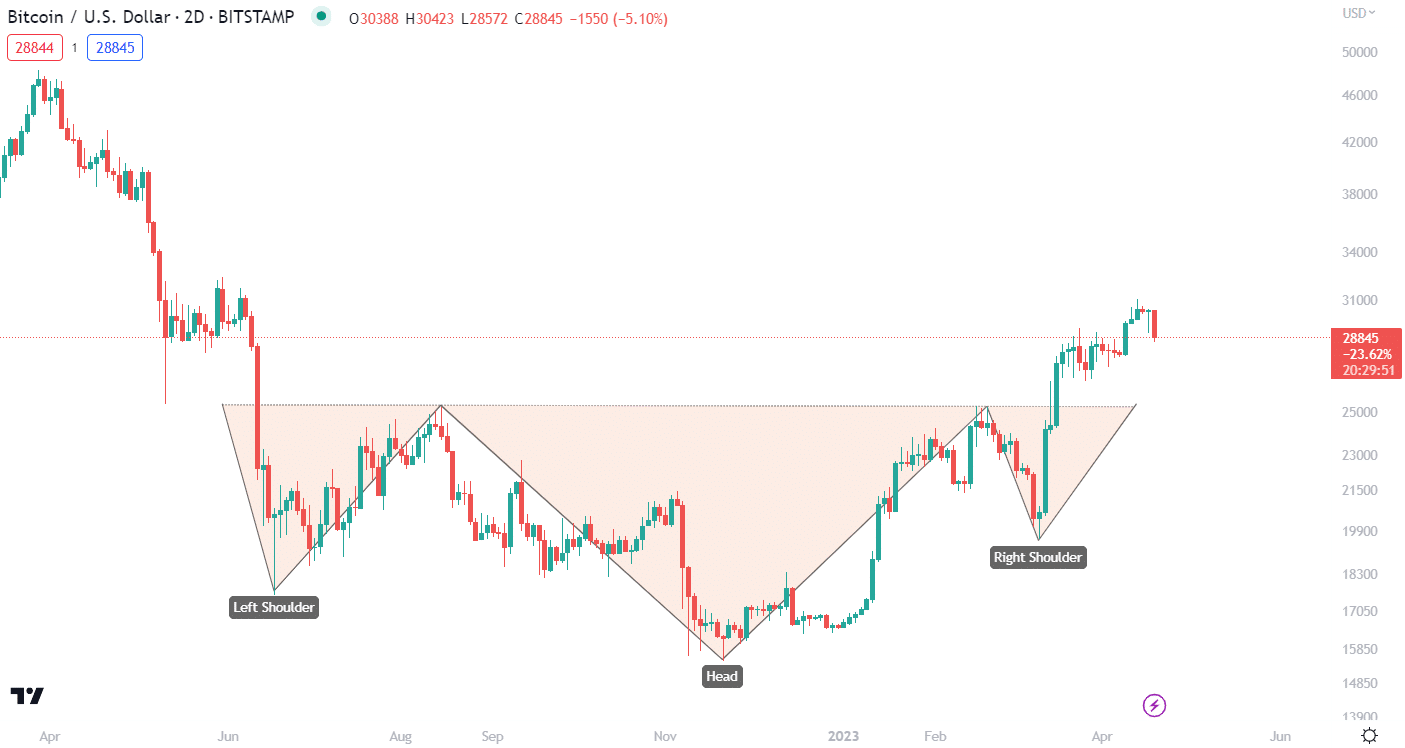
Head and shoulders are typically used to find trend reversal signals in the price action of a cryptocurrency. They can be used to identify bearish and bullish reversals, which can provide traders with entry and exit positions for digital assets. The telltale sign of a head and shoulders pattern is a baseline paired with three triangles. The middle triangle is the tallest, while the two on either side are shorter, appearing much like its namesake – a head and shoulders. This typically signals a bearish reversal, while an inverse head and shoulders suggest a bullish breakout. This pattern can be easily overlayed on charting sites like TradingView.
Pros:
- Easy to identify
- One of the most reliable chart patterns
- Perfect for beginners
Cons:
- Traders need to wait until the pattern is fully identified before the signal is reliable
2. Ascending And Descending Triangle
Ascending and descending triangles are continuation patterns that can help traders identify momentum and breakouts in the price action of a cryptocurrency. An ascending triangle pattern will have a horizontal line over the ranging highs (resistance level), while the ranging lows (support level) will be an ascending trend line. When the price action breaks the horizontal resistance level, this suggests a bullish breakout. The inverse is true for descending triangles.
Ascending and descending triangles are quite effective (70% estimated success rate) and fairly easy to identify. Beginners can benefit from looking for triangles as they are a variation of a basic support and resistance trading strategy. However, they can easily be mistaken for other, triangle-based chart patterns which means some experience will improve the identification of the signal.
Pros:
- Built on a simple fundamental support and resistance strategy
- Highly accurate
- Easy to implement trades based on patterns
Cons:
- Price can breakout in the opposite direction
- Unreliable the fewer times the support/resistance line is hit
3. Bullish and Bearish Flag
Bullish and bearish flags are continuation patterns that are most effective when identified during trending markets. These trading signals often occur within a very short period on a price chart (although the chart can be any size). The flags can be used to suggest whether a pre-existing trend will continue – therefore, they are less effective in ranging markets.
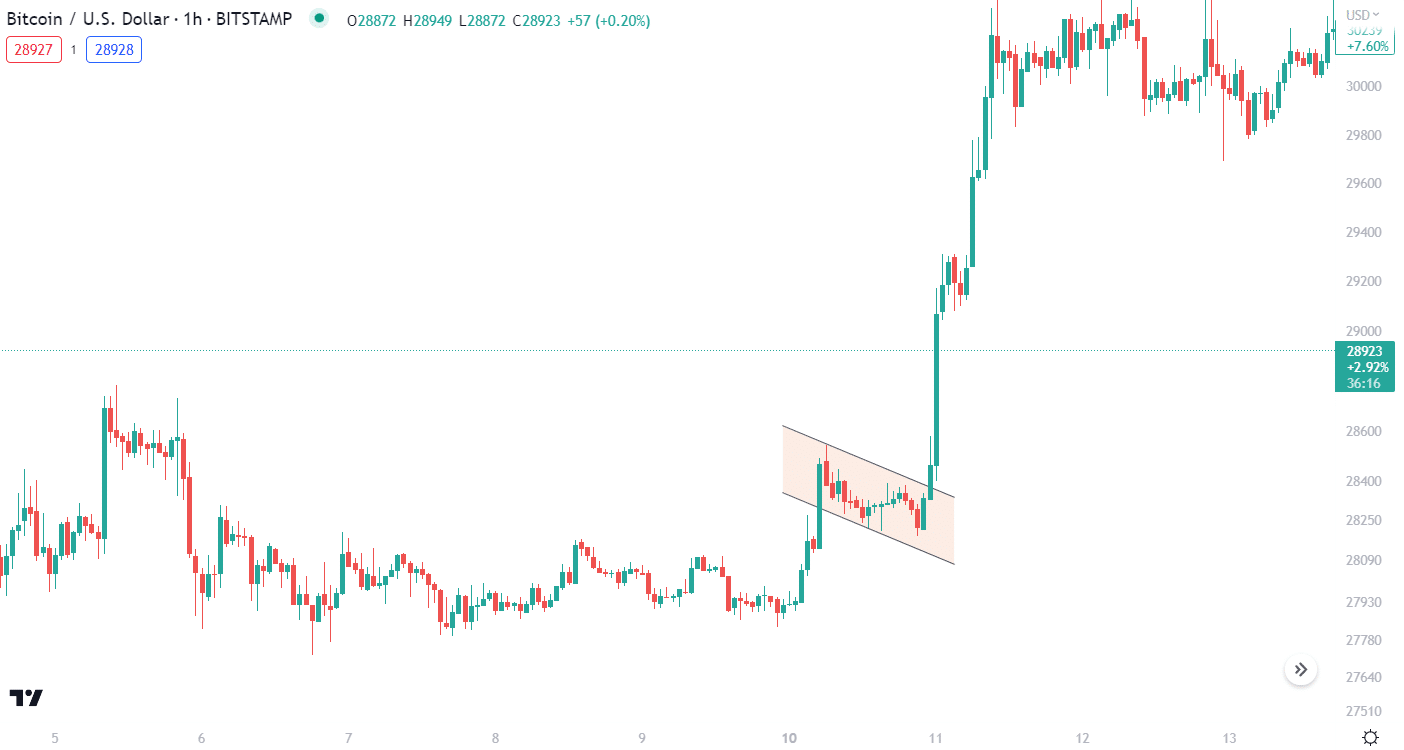
Flags are essentially adjacent support and resistance levels that, instead of being horizontal, are sloped upward or downward. Downward slopes, when the flag is making lower lows and lower highs, suggest a bullish breakout in the context of a pre-existing bullish trend. The inverse is true too. The smaller the gap between highs and lows, the more likely the pattern will be successful. On average, the flag pattern is successful around 65% of the time. While beginners and intermediate traders can spot flags, they are sometimes only effective in specific market conditions.
Pros:
- Can signal breakouts
- Can be identified on charts of any size
- Not too hard to identify
Cons:
- Might only occur after a coin has already risen substantially in price
- Most useful in trending markets
4. Rectangle Channels
Rectangle channels are an easy-to-spot continuation pattern that is very similar to bullish and bearish flags. This signal typically follows a period of price trending and can indicate whether the momentum will continue with another bullish or bearish breakout. The rectangle consists of horizontal support and resistance lines as the price action consolidates after a strong market trend.
The price will bounce between the support and resistance lines before eventually breaking out. The more times the price hits the support and resistance, the more reliable the signal will be.
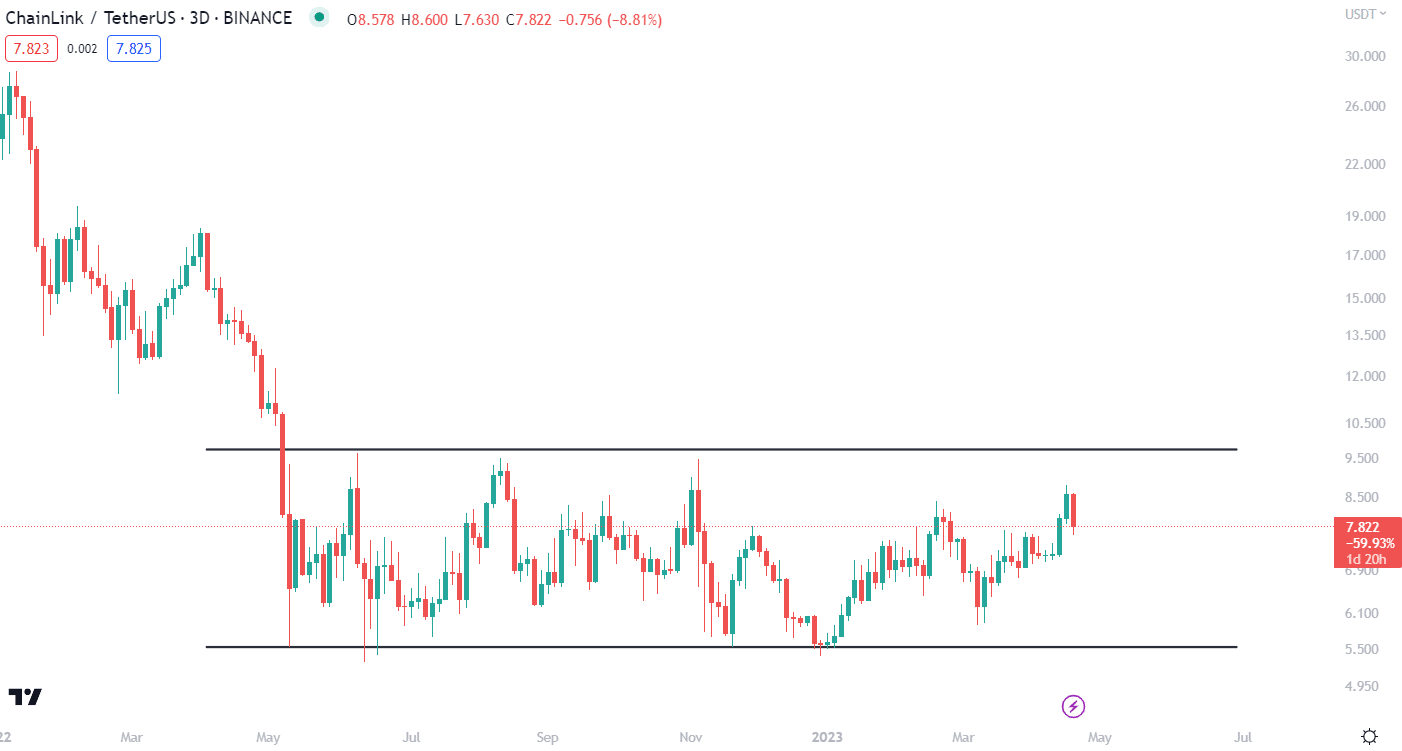
On average, rectangle channels are successful 80% of the time, making them excellent for beginners to trade cryptocurrency. A rectangle breakout is considered successful when the price action trends down (or up) greater than it was ranging within the rectangle. The rectangle pattern can be combined with indicators, chart patterns such as the swing pattern failure, or advanced strategies like liquidity sweeps to increase its win rate.
Pros:
- Can signal trend breakouts
- Easy to identify
- Uses basic support and resistance levels
- High hit rate, making it great for beginners
Cons:
- Can be slow to develop
- Most effective in trending markets
- The signal may come after the price of a coin has already dropped/risen substantially
5. Ascending and Descending Channels
Ascending and descending channels are another continuation trading signal that is very similar to flags with one key difference – the price range is usually much higher. This means that the ascending and descending channels appear wider on a chart than flags do, and typically comprise more “hits” on the support and resistance trendlines. The signal comprises two parallel sloping lines, either ascending or descending and occurs following a significant upward or downward trend.
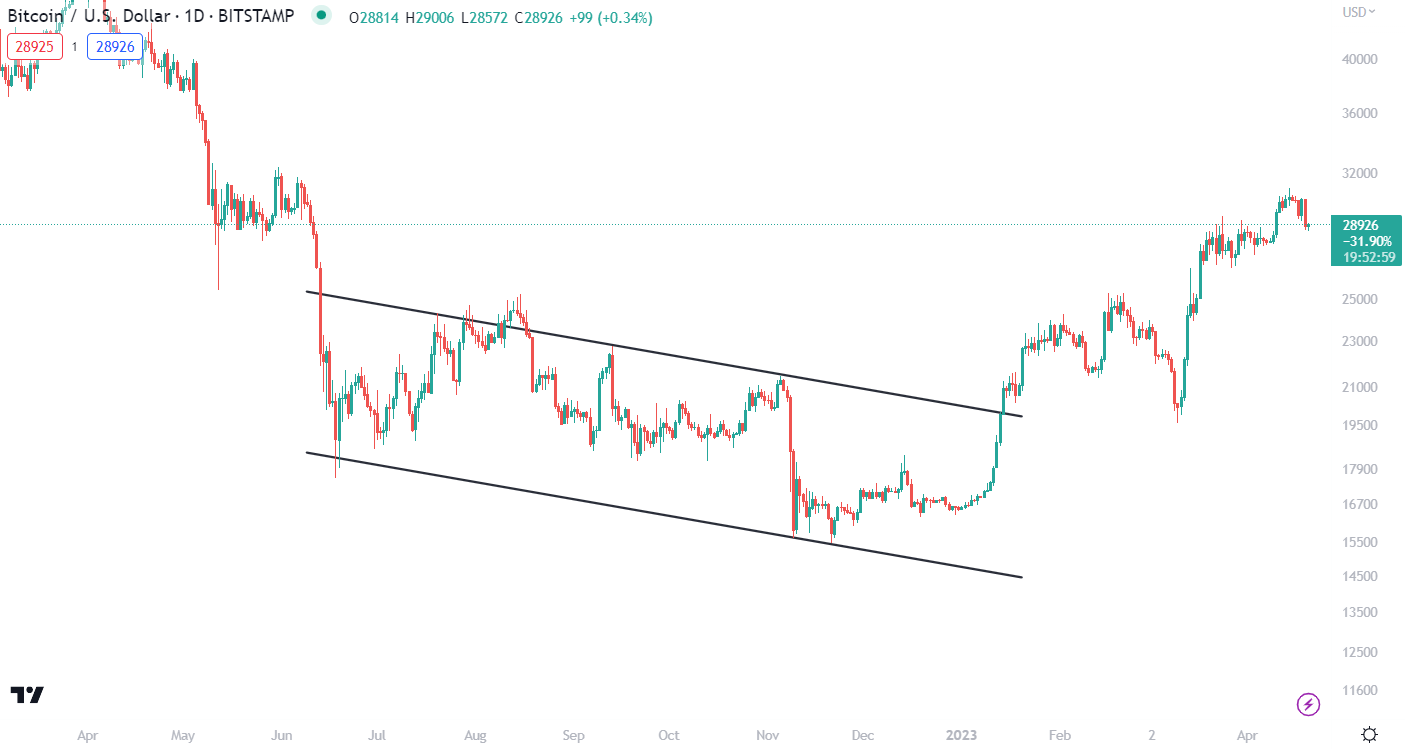
Because ascending and descending channels are wider and involve more price action within the signal, they are typically more accurate than flags, with a success rate of approximately 70+%. They are easier to identify than flags, but may still be more effective when used by intermediate traders given their close resemblance to rectangular channels and ascending/descending flags.
Pros:
- Can signal trend breakouts
- Uses basic support and resistance levels
- More effective than flags
Cons:
- More useful in trending markets
- Can be confused with ascending/descending flags
6. Rising And Falling Wedge
Rising (bearish) and falling (bullish) wedge patterns are commonly used by traders to identify potential trend reversals and a suitable time to trade a crypto pair. They can also be used to test the momentum of a pre-existing trend. A wedge, like many other chart patterns, is built on support and resistance fundamentals and comprises two sloping lines.
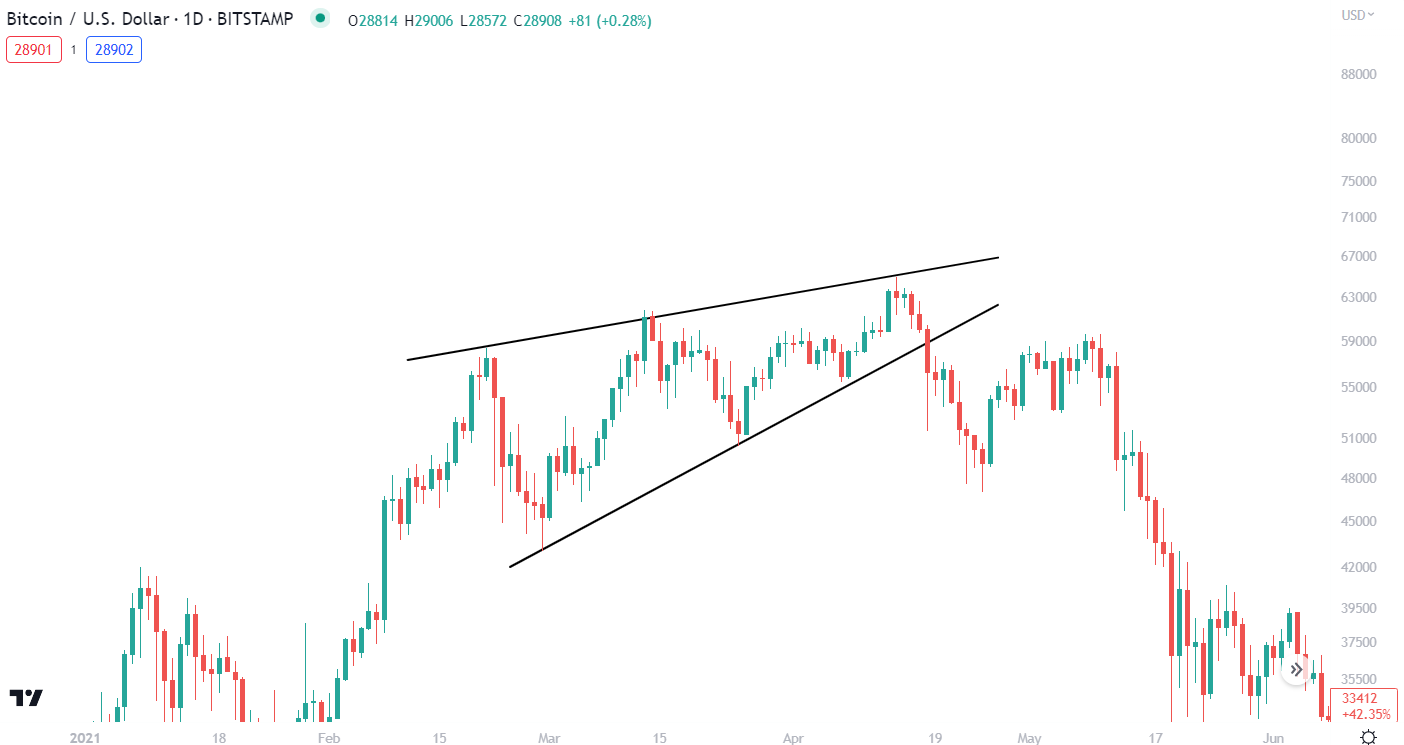
However, a wedge is distinct in that the two lines are not parallel – instead, they are converging. A rising wedge occurs when the bottom line (support) is making higher highs and closing in on the resistance line. When paired with decreasing volume, this typically suggests a bearish reversal to short a crypto asset. The inverse is true for a rising wedge.
Wedges are considered successful about two-thirds of the time, making them relatively effective. They are also fairly easy to identify, but depending on where the support and resistance lines are being drawn, can be subjective and misinterpreted. Due to this, they are likely more effective when used by intermediate and advanced traders – but beginners can benefit from learning the wedge pattern too given its versatility.
Pros:
- Falling wedges suggesting a bullish breakout are more reliable
- Easy to implement a trading strategy based on trend reversals and continuation
- Occurs frequently in all markets
Cons:
- Can be subjective (keep moving the trend lines to suit bias)
- Not as accurate over short periods of time
7. Bullish and Bearish Pennant
Bullish and bearish pennants are very similar in appearance to flags with one key difference. Rather than the trend (support and resistance) lines being parallel to the price action, they are instead converging. Otherwise, the mode of identification is the same – pennants can be spotted following a significant trend. During a period of consolidation, the price will bounce between two trendlines – however, the gap in the peaks and troughs progressively gets smaller.
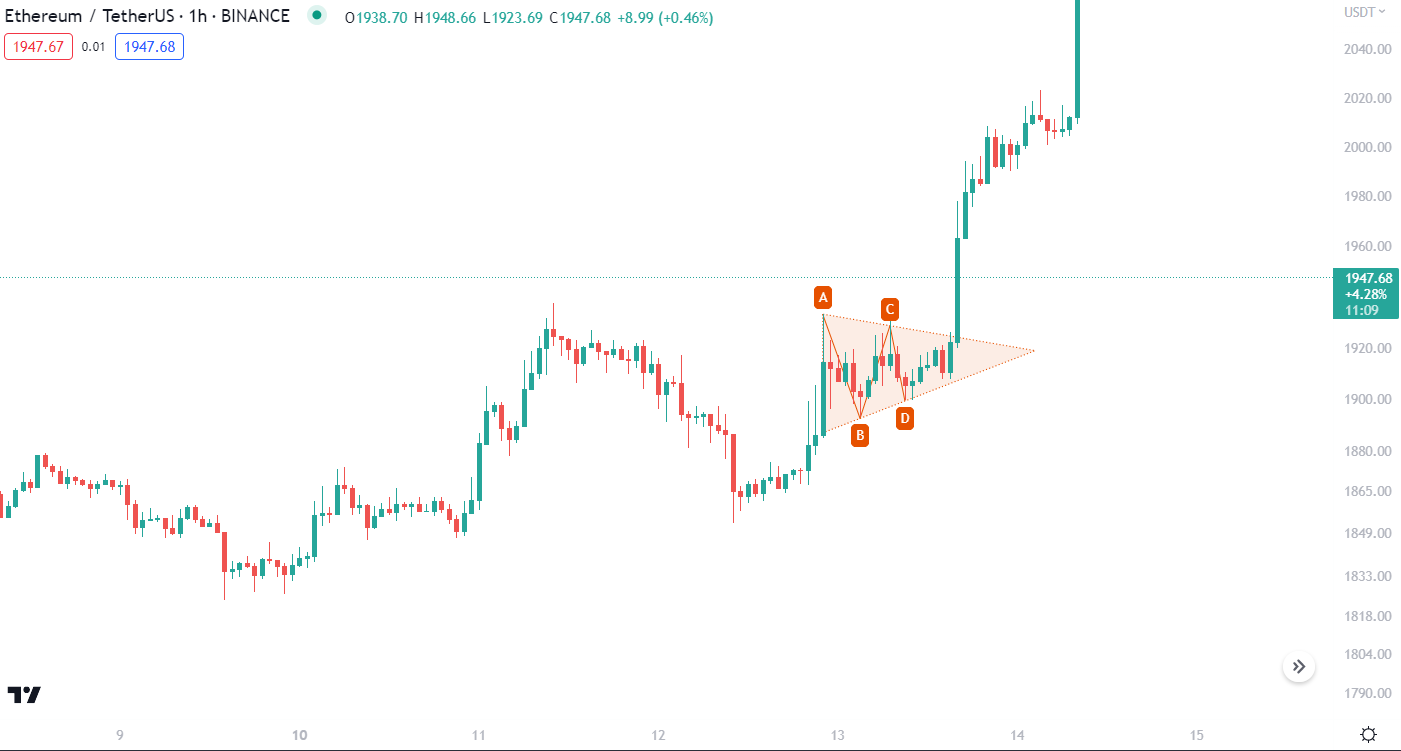
Bullish and bearish pennants tend to be a continuation signal, suggesting that a trend will either continue or reverse. According to several studies, they are one of the least reliable popular trading signals, only successfully suggesting a breakout about 55% of the time. This, paired with their close resemblance to flags, makes them difficult for beginners to master. However, pennants are a vital pattern to remember to help traders distinguish between triangles, flags, pennants, and rectangles.
Pros:
- The implications of a pennant are easy to understand and act upon
- Can provide simple trading opportunities
Cons:
- Not as effective as other chart patterns
- Usually only appears in trending markets
- Can be hard to distinguish
8. Double & Triple Top and Bottom
Double/triple tops and bottoms are an example of a reversal price pattern. This chart signal is relatively easy to identify, taking the form of a “W” or “M” shape. These patterns tend to be identified during trending markets and are built around support and resistance levels.
A double top occurs when the price, after moving upward, bounces between parallel support and resistance levels twice, before falling below the bottom trendline. If the price action bounces three times, this is a triple top. Double/triple tops are a bearish signal and suggest the price of an asset has finished breaking out and is likely to consolidate. The inverse is true for double/triple bottoms.
These chart patterns are usually more effective the wider the gap between the price action touching the support/resistance trendlines. In addition, a triple top and bottom are generally more effective than a double top and bottom. On average, this chart pattern has a success rate of over 75% and is quite easily spotted, making it a solid pattern for beginner and intermediate traders to master.
Pros:
- Solid success rate
- Easy enough to spot
Cons:
- Can be confused with other similar patterns like flags or rectangles
- More effective in trending markets
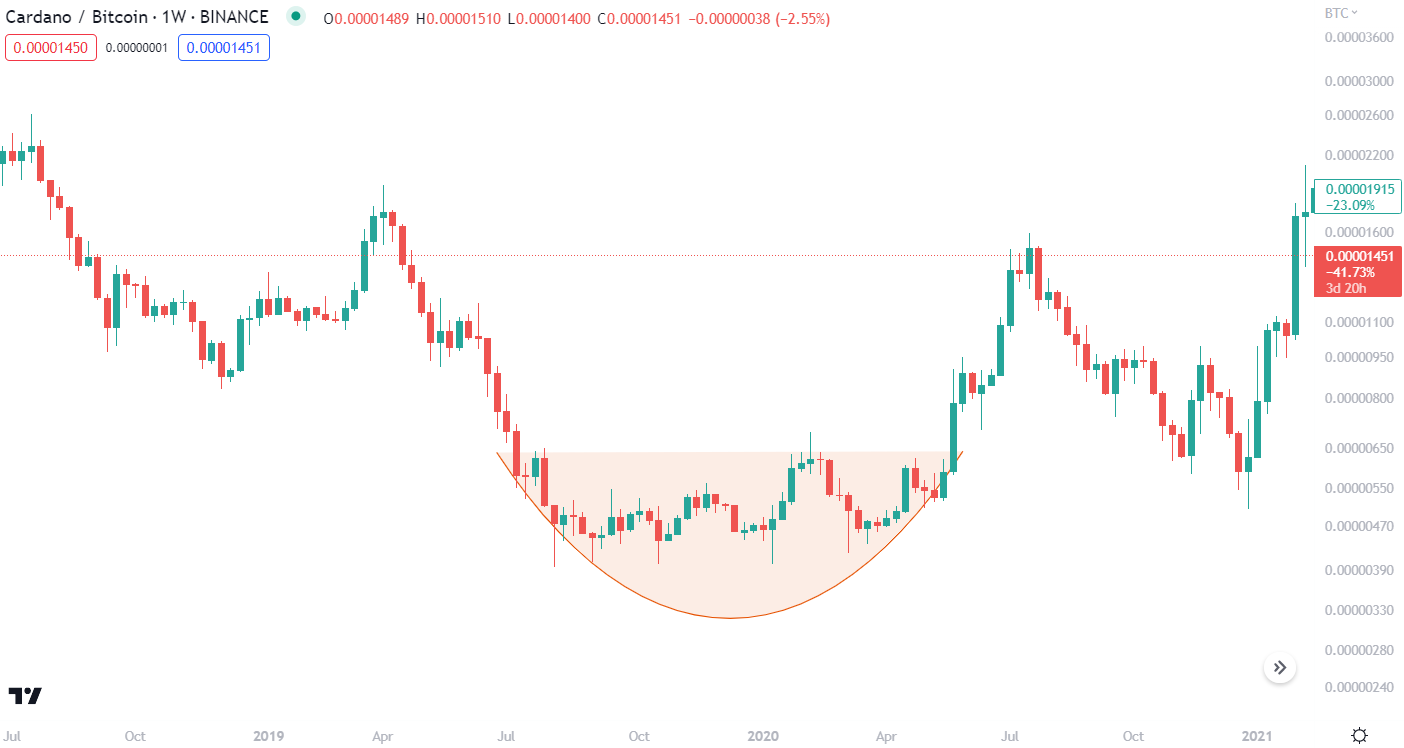
9. Cup And Handle
The cup and handle chart pattern is one of the most ubiquitous signals in technical analysis and is quite popular among traders. It is a bullish continuation pattern that occurs during a period of consolidation in an upward-trending market. The cup is a rounded bottom (support level) that follows a sharp drop in price that climbs back up to its original value. The handle can then be identified as two parallel trend lines sloping downward. This pattern suggests the price will eventually break out of the handle pattern and the bullish trend will continue.
The cup and handle is a relatively effective chart pattern, with the price breaking out of the handle around two-thirds of the time. It is most useful during a bullish trend and can help traders find an entry point for crypto trades that are experiencing a bull run. However, identifying the cup and handle is rather subjective, making its interpretation prone to errors and false signals.
Pros:
- A relatively common pattern during the bull run of a cryptocurrency
- Very useful for identifying bullish momentum
Cons:
- Less useful for bearish continuation
- Identifying the cup and handle can be quite subjective
- Not the greatest success rate
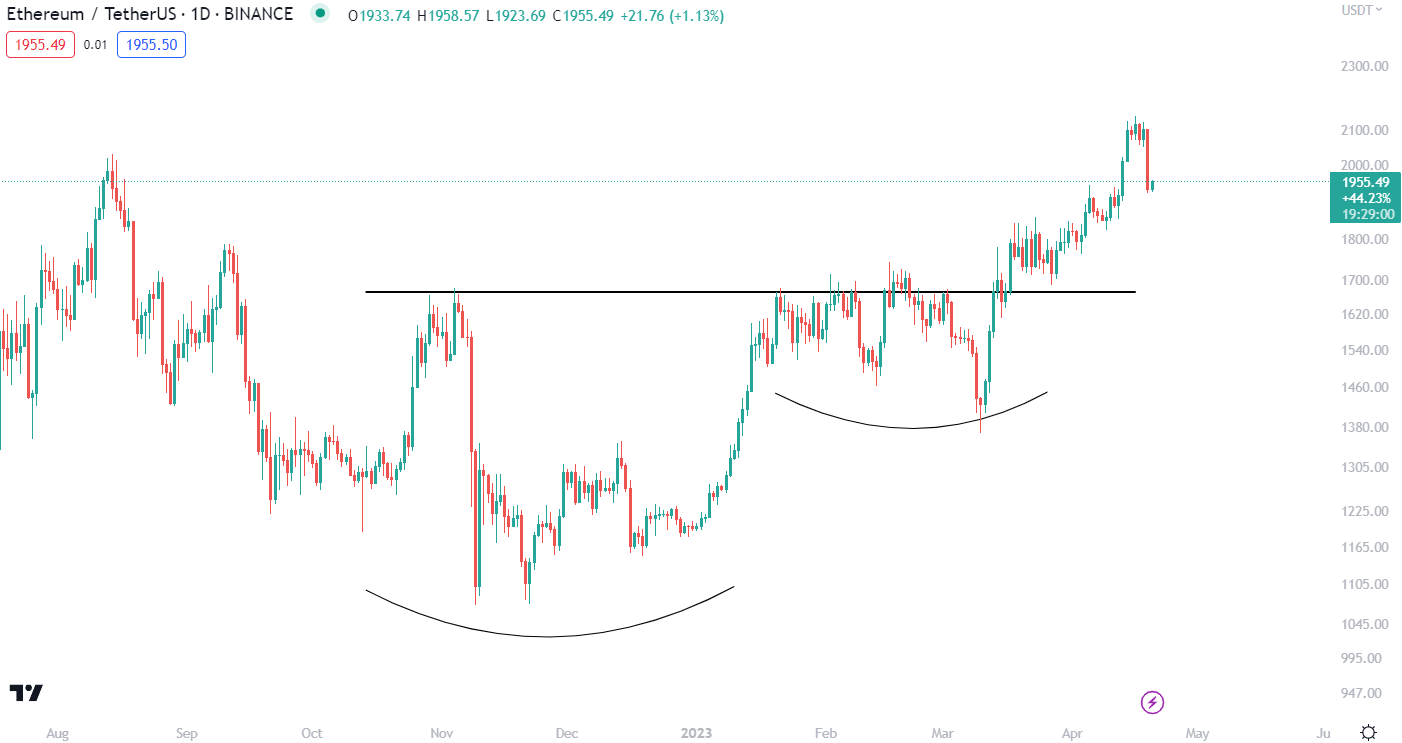
10. Rounded Bottom and Top
A rounded bottom and top chart pattern is a reversal signal that typically occurs following an up or downtrend in an asset’s price. During a consolidation period, a rounded top/bottom will appear as a “U” shape that covers the peaks/troughs of a cryptocurrency’s price action. A rounded top (upside-down “U”) suggests an asset’s bull run is coming to an end, while a rounded bottom suggests the price has bottomed out and is set to rise.
Rounded bottoms and tops are typically found alongside an inverted volume pattern, where the volume starts off strong, gets weaker in the middle, and then rises again. It’s worth noting that a rounded bottom/top that does not reverse (about 40% of the time) may turn into a double/triple top/bottom, and instead become a continuation signal. This distinction is important to make as it can completely alter a trading strategy but often doesn’t become clear until the trend has already taken shape.
Pros:
- Can signal significant price breakouts
- Is associated with changes in volume, making it easier to identify
Cons:
- More useful during trending markets
- Can be slow to form, reducing potential profit opportunities
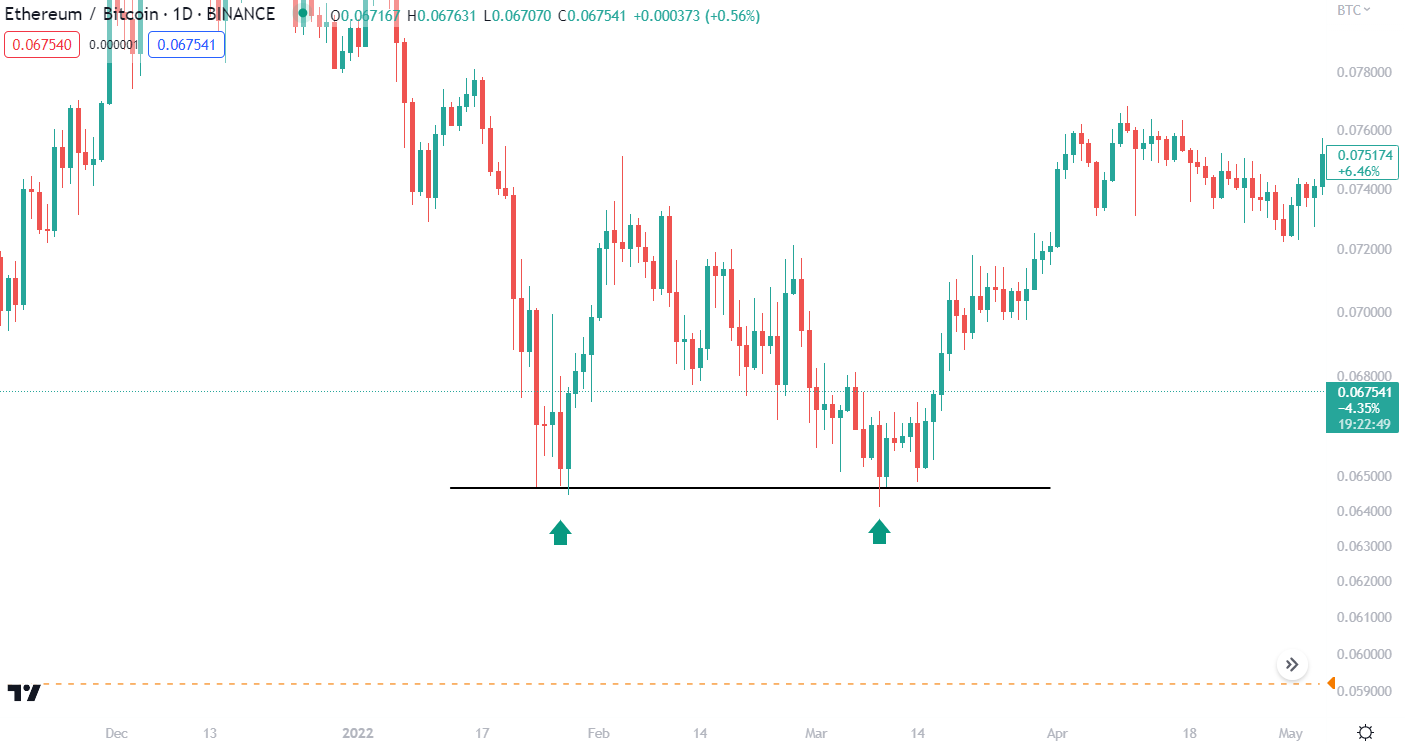
11. Swing Failure Top And Bottom
Failure swings are a popular chart pattern for serious traders that can appear when performing technical analysis on a cryptocurrency. It is considered a very reliable reversal signal in an already-trending market.
A swing failure top and bottom are built upon the principles of support and resistance. For example, let’s say the price of an asset was charging upwards and hit a new peak (point one). In most cases, the price will then swing downward (point two) before coming back up again. If the next peak (point three) fails to hit that first resistance level, it suggests that traders aren’t interested in testing these levels and a trend reversal is imminent.
The inverse is true too – higher swing bottoms during a downtrend suggest the momentum of downward price movement is slowing. The pattern is complete if the price action breaks above/below the point of the second swing.
Swing failure tops and bottoms can form over charts of any duration – whether it occurs over less than five candlesticks, or over a month’s worth of price action. The chart pattern is relatively successful but becomes much more effective when paired with the RSI indicator.
Pros:
- Are quite effective during trending markets
- Present very clear buy and sell opportunities
Cons:
- Best paired with TA tools like the RSI
- Can be difficult to identify
What Are Chart Patterns?
Chart patterns are a pattern that occurs in the price action of an asset when displayed on a graph. They have been used by traders for decades to improve the success rate of trading a market. Chart patterns are heavily built around trendlines, specifically support and resistance levels. Chart patterns are a form of technical analysis that relies solely on data as an interpretation of the crypto market sentiment.
Types of Chart Patterns in Crypto
There are three key types of chart patterns for traders to learn:
- Traditional chart patterns. Traditional chart patterns are patterns that can appear on basic price graphs. They are typically simple to implement and identify and can provide traders with data on trend momentum and potential reversals.
- Candlestick patterns. Candlestick chart patterns can only be identified on candlestick charts, as they involve the “wick” (peak/bottom of daily trading price) and the “candle” (open and close price) of each price period. Candlestick patterns are best suited to longer-term swing traders.
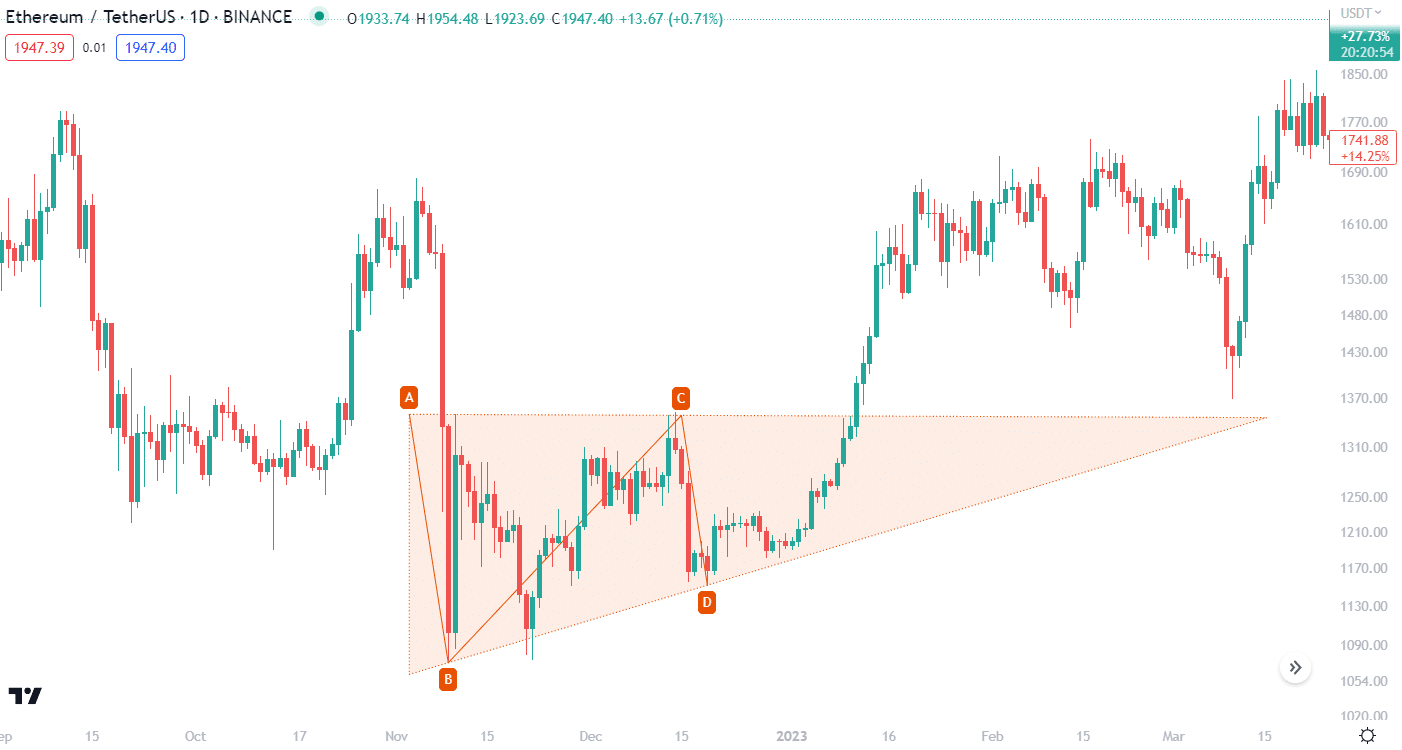
- Harmonic patterns. Harmonic patterns are by far the most complex chart patterns to identify. These patterns utilize geometry – specifically, Fibonacci numbers – to identify trends in an asset’s price action. Harmonic patterns typically comprise at least 4-5 points and tend to form a kite-like shape. There are some simpler patterns (ABCD, Bat pattern) that may appeal to beginners, as harmonic patterns are typically very accurate when identified correctly. For more information on how to trade Fibonacci in crypto, read this tutorial next.
What is the Success Rate of Crypto Chart Patterns?
| Chart Pattern | Estimated Bullish Win Rate | Estimated Bearish Win Rate |
|---|---|---|
| Traditional chart pattern | 65-75% | 62-72% |
| Candlestick chart pattern | 70-75% | 71-77% |
| Harmonic chart pattern | 82-95% | 80-90% |
What Is Required to Find Crypto Chart Patterns?
Crypto traders will need to use charting software with a price chart to find traditional crypto chart patterns. These charting tools can come in many forms, including downloadable software or an online website. Some will be simple graphs that only track the price action of a crypto pair, while others will come with in-built exchanges or technical analysis tools like the RSI and Bollinger Bands.
To effectively find crypto chart patterns, most price charting applications will need to provide traders with the ability to draw trendlines. Platforms such as TradingView are popular, free, and extremely powerful for traders wanting to identify chart patterns.
How to Trade Crypto Using Chart Patterns
- Open the crypto charts. The first step is to choose a charting tool and create an account. Then, open up the charts for a desired trading pair – for example, BTC/USD.
- Scan the price action and identify patterns. Patterns may not appear straight away, so regularly check the price graph set to various periods to patiently identify anything of note.
- Determine the overall trend direction. Different patterns will emerge in different markets (trending or ranging) so it’s important to identify which direction the price action is currently heading.
- Identify any confluences with chart pattern. A chart pattern can help confirm an asset’s current trend direction, or instead, reject it and suggest an imminent reversal.
- Place entry order with take profit and stop loss. Based on the chart pattern identified, traders can find a suitable entry/exit position and set up take-profits/stop-losses according to their trading strategy.
- Monitor trade performance. Setting up a stop-loss/take-profit can take some pressure off, but it’s still important to keep an eye on the trade’s performance. This will help investors improve their skills at reading chart patterns.
Frequently Asked Questions
What is the best pattern for crypto trading?
There is no “one best pattern” for crypto trading. However, chart patterns like Head and Shoulders and Double/Triple Tops and Bottoms have relatively high success rates while being easy enough for beginners to trade. Harmonic chart patterns are usually quite reliable but are difficult to correctly identify.
Do chart patterns work for crypto?
Yes, chart patterns work for crypto the same way they do for any other market. Given crypto’s tendency to trend heavily during bull and bear markets, continuation and reversal patterns can be particularly effective. The overall success rate of the pattern depends on other factors such as risk management and discipline.
How many crypto chart patterns are there?
There are more than twenty crypto chart patterns that traders can identify and use. Patterns are just that – patterns – and it’s even possible for experienced traders to find their own chart patterns over years of trading.
Methodology and Sources
The estimated success rate of the crypto patterns listed above has been calculated as an average from multiple sources including:
- https://thepatternsite.com/
- https://samuraitradingacademy.com/7-best-price-action-patterns/
- https://medium.com/@jan_5421/candlestick-pattern-performances-afe67ef44ce
- https://www.geocities.ws/tradeharmonics/harmonic-pattern-success.html
Ben Knight
Ben Knight is a freelance writer with a passion for music and finance from Melbourne, Australia. He completed his Master's in Writing, Editing, and Publishing in 2019, following a Bachelor's degree in Creative Writing. Ben has been writing in the finance and cryptocurrency industry for more than three years.