We may earn a commission from links on our site, but this doesn’t affect our reviews. Learn more.
Hedge With Crypto is an independent publisher that provides objective and free content. Articles on our site may include links to our partners. If you click on these links, we may earn a commission. However, our editorial content remains unbiased, reflecting our own opinions or the general information available. For more information on our company policies, read the Affiliate Disclosure, Privacy Policy, and Terms & Conditions.
This Is How To Use Fibonacci In Crypto Like A PRO
Fibonacci retracements can be a great way for crypto traders to identify support and resistance levels and assess the potential for trend reversals on a cryptocurrency’s price chart.
Hedge With Crypto aims to publish information that is factual and accurate as of the date of publication. For specific information about a cryptocurrency exchange or trading platform please visit that provider’s website. This information is general in nature and is for education purposes only. Hedge With Crypto does not provide financial advice nor does it take into account your personal financial situation. We encourage you to seek financial advice from an independent financial advisor where appropriate and make your own inquiries.
TABLE OF CONTENTS
The Fibonacci sequence is a set of specific ratios that can help crypto traders identify support and resistance levels for a certain crypto asset. This tool allows investors to determine effective entry points during a trending market and predict when the momentum of a run may shift. This guide explains how to use Fibonacci in crypto trading to add confluence to your crypto trading strategy.
How To Trade With Fibonacci Extensions & Retracements
1. Open the crypto charts
Technical analysis is most often performed on a price chart of the asset being assessed. Therefore, investors will need a form of charting software to plot the Fibonacci sequence against price action. There are several powerful crypto charting platforms with customizable indicators. Many of the more popular exchanges – especially those with an emphasis on trading like Binance and ByBit – will come with integrated charting features. Another option is to use a dedicated application like TradingView, which is one of the best free platforms for traders on the market. To get started, simply make an account using an email and password.
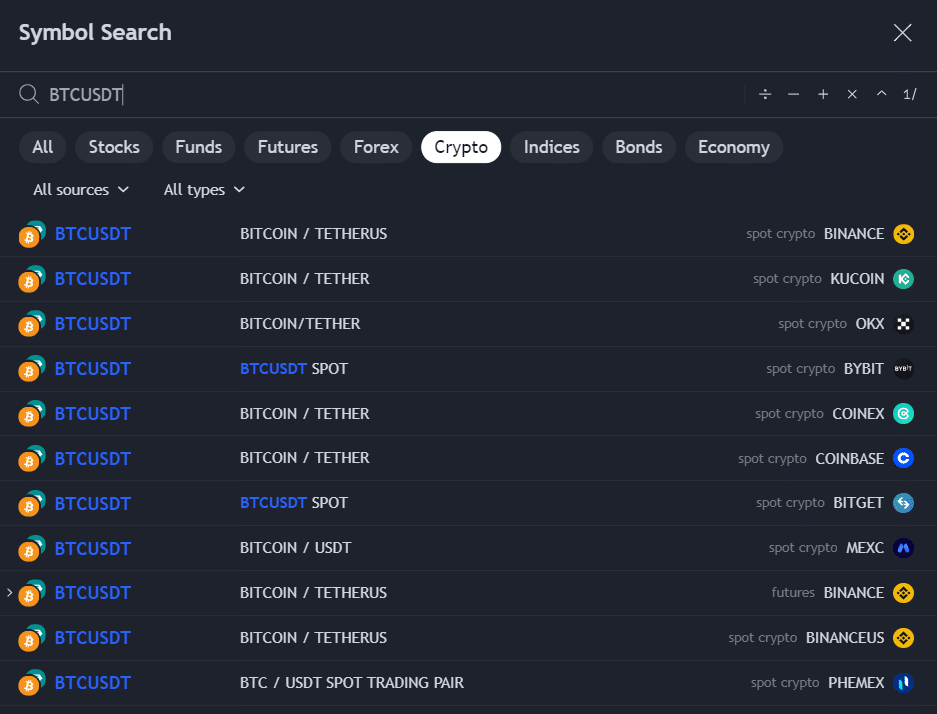
2. Find and choose a crypto trading pair
Dedicated platforms such as TradingView give investors the choice of thousands of trading pairs across all markets – including crypto. Let’s say a US trader wanted to use Fibonacci sequences to trade Bitcoin. They would likely choose a pair such as BTC/USD or BTC/UST to keep the price chart consistent with their local fiat currency. Additionally, modern charting interfaces like TradingView will have different pricing options for the same pair – for example, a BTC/USD based on the spot price of either Binance or Kraken. Investors should select the trading pair that uses the price from their exchange of choice.
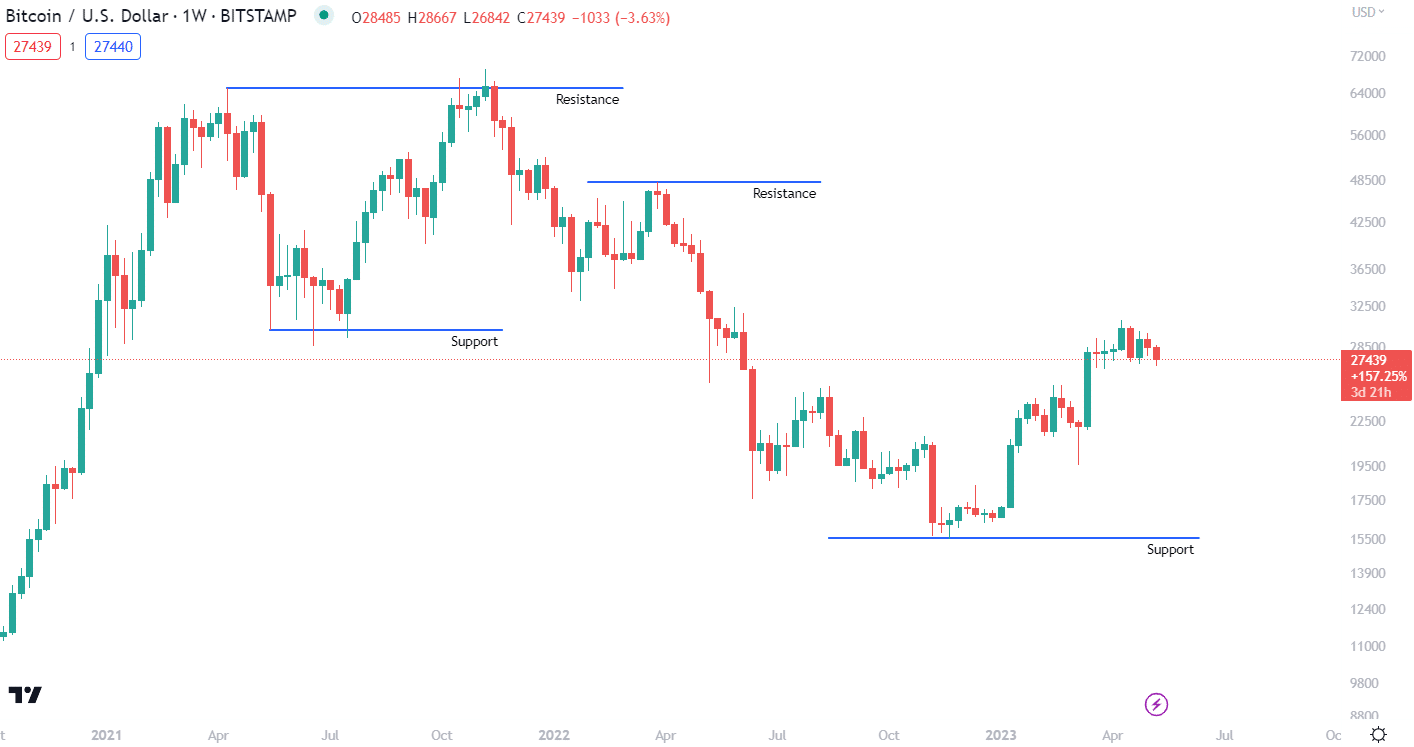
3. Find a support and resistance level
Find the major resistance and support levels of the crypto’s price action, and use the TradingView trend line tool to draw a solid line between two points. This can help visualize where to place the Fib retracement in the next step. The bottom of our trendline will be the bottom Fibonacci line, and vice versa.
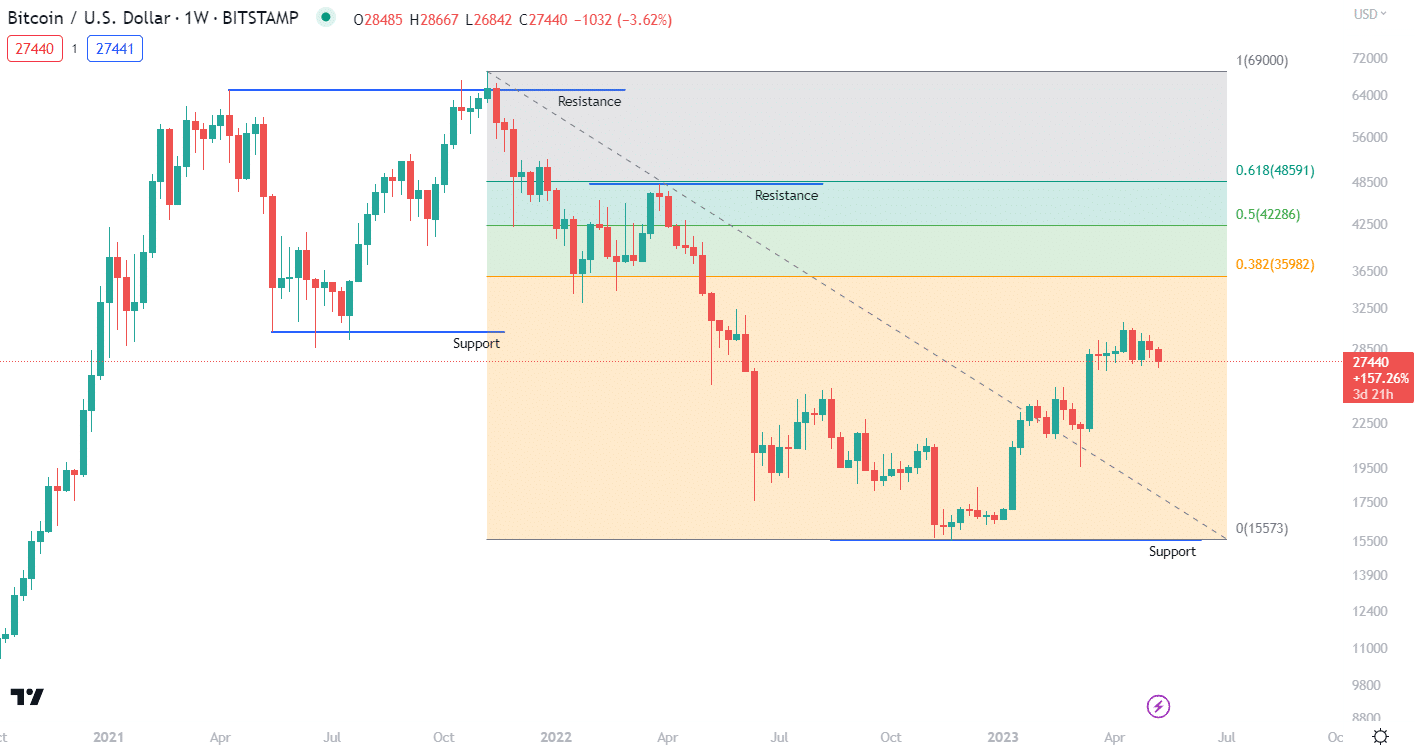
4. Add the Fibonacci retracement overlay
Load up the Fibonacci retracement overlay. On TradingView, it is located immediately underneath the trendline drawing tool and resembles four horizontal lines. Once the overlay is selected, click from the swing high (or low) and draw to the opposing swing level. Using the “magnet” tool can help to draw the overlay from the extremities of the candle body or wick.
Open the indicator settings to select the Fibonacci levels to show. The most common Fibonacci settings for crypto are 0.382, 0.5, and 0.618 levels.
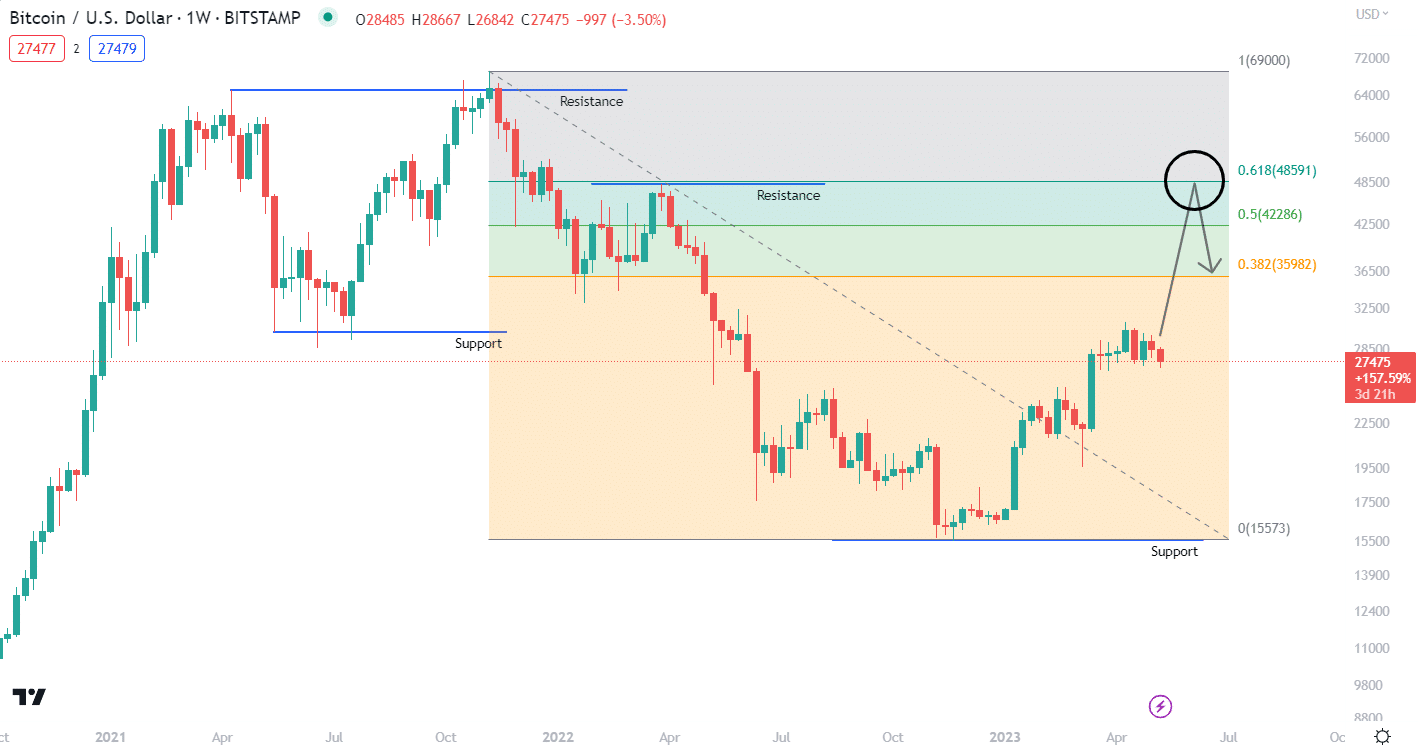
5. Use the Fibonacci retracement levels to identify potential trend reversals
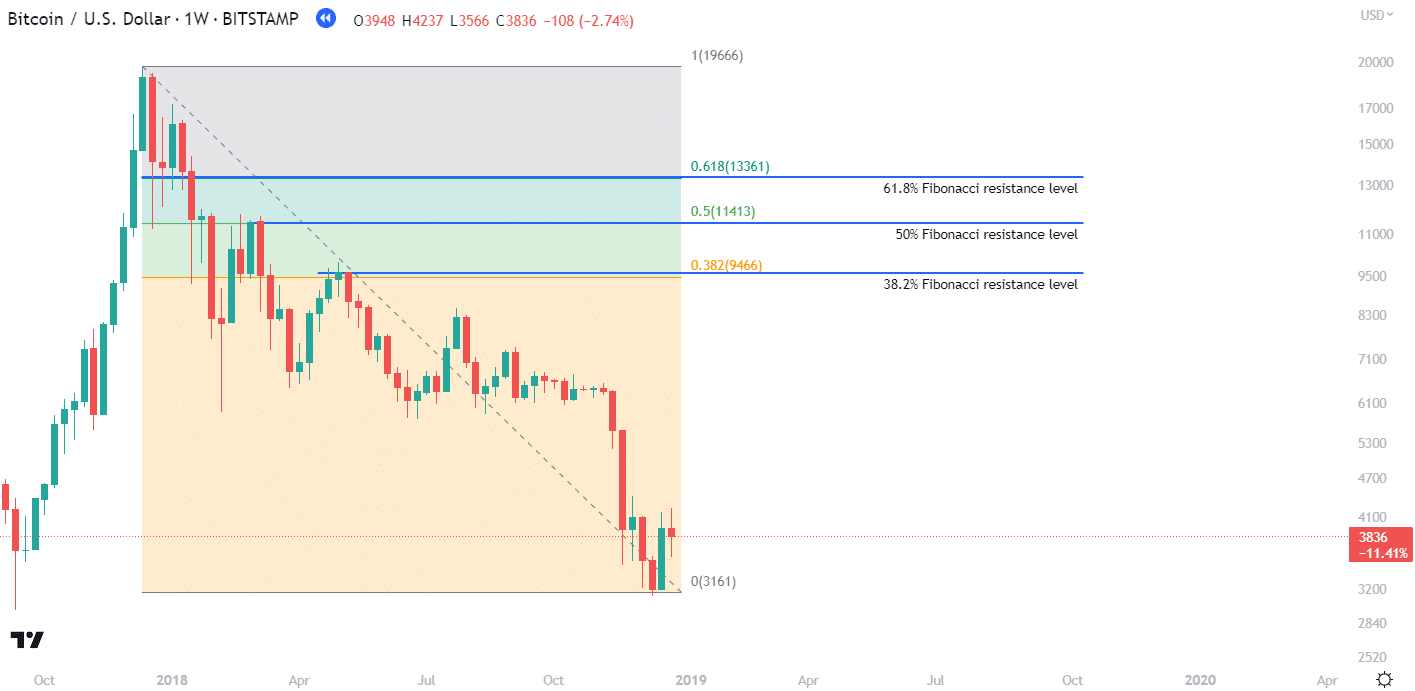
The multiple lines of the Fibonacci retracement overlay are various different mathematical ratios that align with the Fibonacci sequence. In very simple terms, traders can view each ratio line as a mini-support/resistance zone. The simplest principle to apply is, whenever the price action enters a new zone rather than just bouncing off the Fibonacci support and resistance, it should be considered a potential “reversal flag”.
Based on the above graphic, it is possible that the price will react at this level and potentially reverse at the 0.616 Fibonacci line, which is also a key resistance area that we marked out in Step 3.
6. Confirm potential retracements with other indicators and analysis
Whenever the price data of a cryptocurrency enters a new Fibonacci zone, it’s pivotal for traders to double-check the potential trend reversal with other forms of technical analysis. There are several cryptocurrency trading indicators that can be effectively used alongside a Fibonacci retracement level. For example, an investor might add an RSI and Bollinger Band indicator to search for oversold conditions during a downtrend.
7. Make trades based on the Fibonacci retracement levels
If the price enters a new Fibonacci zone and other indicators are confirming a potential trend shift, this can make for a very simple trading strategy. Traders can buy in at the Fibonacci support level of the relevant zone and then set a take-profit at the resistance level of the same zone. Adding in a stop-loss at the next support level can also help mitigate risks and form part of a well-rounded trading strategy. Read this tutorial on how to trade crypto for a full explanation of placing trades.
What Is The Fibonacci Retracement In Crypto?
The Fibonacci retracement is a form of technical analysis that relies on the principles of support and resistance levels. The basis of the levels comes from the Fibonacci sequence, a sequence of numbers where the two preceding numbers add up to the following number (e.g., 1+1=2, 2+1=3, 2+3=5, 5+3=8). Fibonacci retracements are most often used to find shifts in price trends, whether they are total reversals or just minor corrections.
Fibonacci numbers have been around for centuries, as they were apparently used by Ancient Indians as far back as 450 BCE. The figures were then taught to mathematician Leonardo Fibonacci, who popularized the patterns upon bringing the concept back to his home in Italy.
Fibonacci Trading Pros and Cons
Pros:
- Can provide multiple trading opportunities for day traders and swing traders during a trending market
- Although it can sound intimidating, the basic Fibonacci retracement tool and trading strategy are easy to implement, even for the inexperienced
- The strategy is largely based on human psychology, which can be very effective when trading financial markets
Cons:
- The tool should never be used in isolation – the price action of a crypto pair can enter a Fibonacci zone, break the resistance level, and not reverse or correct whatsoever
- Identifying the correct starting point of a trend can be difficult, especially on longer-period charts
- Not very useful in ranging/sideways markets
Fibonacci Retracement Works Like This
The Fibonacci retracement drawing pattern is based on numbers from the Fibonacci sequence. The sequence itself isn’t totally mathematically significant – however, the ratios between the numbers are. This leads to five ratios that the Fibonacci sequence suggests are important in both broader nature and in trading – 23.6%, 38.2%, 50%, 61.8%, and 78.6%.
When these figures are utilized in a trading strategy, they appear as Fibonacci zones, each with a support and resistance line that can be used to identify trend reversals. To use the overlay, a trader will place the Fibonacci between two extreme points in a price graph—usually the highest peak and lowest trough of a consistent trend.
The concept behind Fibonacci retracements is that during a trend – bullish or bearish – the price will typically retrace some amount, before continuing on its longer-term trend. This presents various opportunities for traders to profit using such a strategy. Paired with Fibonacci ratios, investors can see the most likely areas where a trend might momentarily correct and provide an entry/exit point.

Did you know? The Fibonacci sequence’s “golden ratio” is 1.618, which occurs when dividing any number in the sequence by the one before it. This number regularly pops up in the natural world – for example, the number of female bees divided by male bees in an average hive will almost always equate to 1.618. Or, the position of a dolphin’s eye, fins, and tail are all aligned with the Fibonacci golden ratio.
Crypto Indicators To Use With Fibonacci Retracement
Fibonacci retracement and extensions are some of the most commonly used drawing overlays that can be used effectively to identify potential entry and exit points for any crypto trading pair in the market. However, while certain strategies may rely totally on Fibonacci drawings, using multiple signals and indicators can increase its probability. Here's a list of indicators that can be used to complement Fibonacci retracements:
- Moving Average Convergence Divergence. Momentum oscillators like the MACD are a popular way to identify a confluence of signals while trading with a Fibonacci retracement tool. The MACD is a particularly powerful pairing as it can be used to confirm Fibonacci support levels (through bullish divergences).
- Relative Strength Index. Other momentum oscillators like the RSI are useful for determining potential trend reversals, which can help prevent traders from buying into false retracement levels.
- Bollinger bands. Bollinger Bands are a popular momentum crypto indicator built around the RSI indicator. When the extremities of the bands align with larger structure Fibonacci levels, it can provide additional confluence to predict a change in price direction.
How Fibonacci Levels Can Help Crypto Traders
There are several different strategies traders can employ when using the Fibonacci retracement drawing. It is an extremely versatile measurement that can uncover all sorts of profitable cryptocurrency chart patterns that can be used to execute trades. The foundation of its excellent adaptability is that the overlay is just as useful in day trading as it is in assessing long-term trends. That way scalpers, swing traders, and long-term investors can all benefit from using Fibonacci retracements.
When using charting software to apply Fibonacci retracements during a coin’s uptrend, traders should generally drag the tool from the bottom of the price action to the top. Conversely, during a bear run a trader should be dragging from top to bottom.
1. Identify support and resistance levels
The main use of the Fibonacci retracement overlay is identifying key support and resistance levels. These levels form the basis of hundreds of trading strategies, from extremely simple to complex. They can also provide valuable insight into human psychology and sentiment for a particular cryptocurrency.
Support and resistance levels are built on the idea that no market trend is 100% linear – there will be points where buyers or sellers start to lose faith in the trend and start buying or selling.
They can be used to give traders somewhat reliable markers for entry and exit points. The Fibonacci retracement’s most important level is the 0.618 ratio. This is considered the “golden ratio” in both nature and trading. This tends to be the last level of resistance from sellers during an uptrend, where they eventually are overwhelmed by buyers, and the upward momentum reappears. The inverse is true during a downtrend too.
2. To find trade entry and exit levels
When the Fibonacci retracement overlay is applied to a trending cryptocurrency’s price chart, traders are given three (or more) potential support and resistance levels that can inform their next moves. Let’s use the example from above and assume the price of BTC has just rocketed to $20,000 and a trader is looking to find an entry point to enter a short position on Bitcoin.
When the Bitcoin price retraces and tests the first Fibonacci resistance level—usually 38.2%—this could present a trading opportunity to short the downward trend. If BTC’s price action hits this multiple times but doesn’t break through, a trader might interpret this as a reliable entry signal and sell at this level.
If the market breaks the 0.383% Fibonacci level, the next potential reversal area is the 61.8% retracement. In the example above, the $13,300 area is the 0.618 level from the swing high of $20,000. We can see that price re-tested the Fibonacci level and turned sharply.
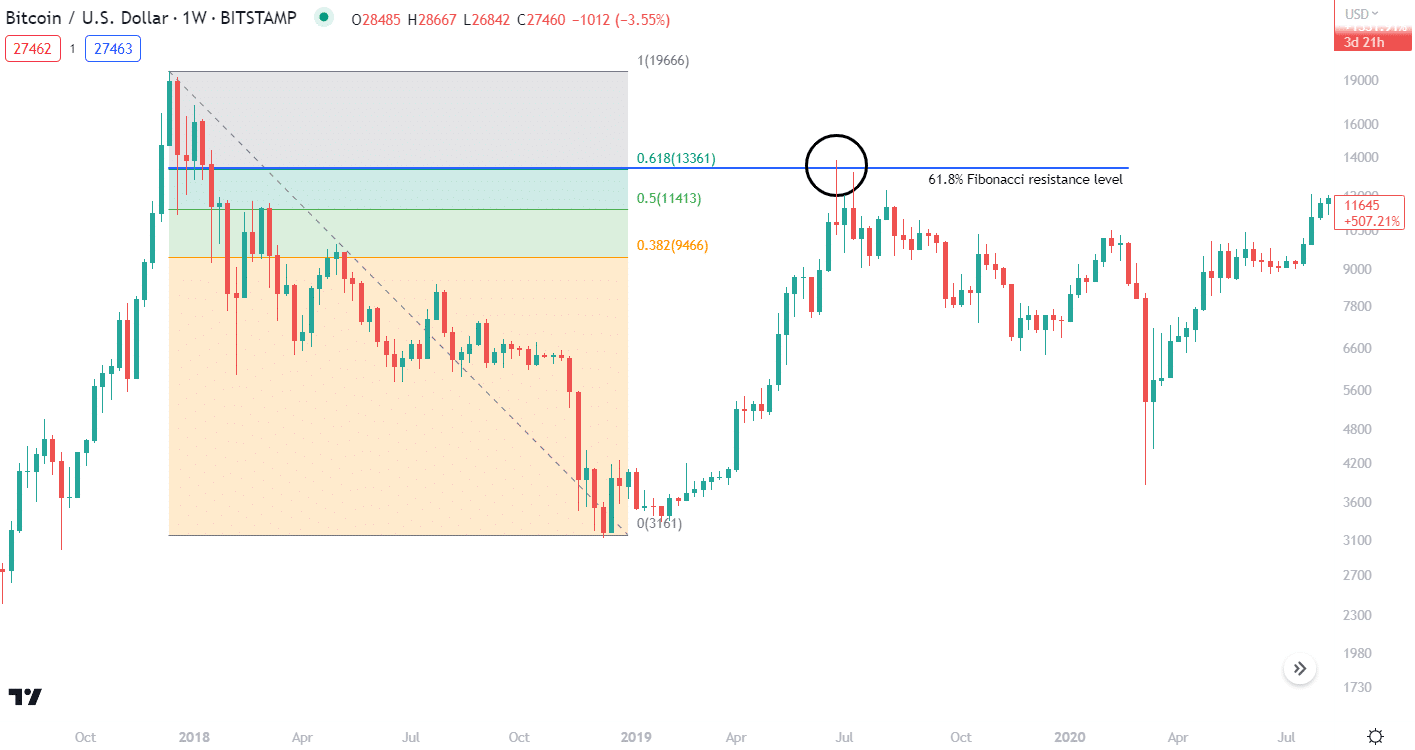
Of course, it’s important to remember that a retracement is never guaranteed to be just that, and might end up being a trend reversal. In this situation, both of the above traders would lose money – particularly those using the more aggressive strategy. That’s why it’s so important to ensure Fibonacci retracements are used in confluence trading to identify trend momentum and potential shifts.
To trade Fibonacci retracement using this strategy:
- Select a crypto trading pair that is trending.
- Find the peak and trough of the trend and drag the Fibonacci retracement lines between them.
- Monitor the price for any retracement that breaks the current trend.
- Enter a long (or short) position based on the Fibonacci support/resistance levels that correspond with the current price action. For example, during an uptrend, a trader might place a buy order at the 0.5 retracement level.
- Identify potential stop-loss levels and set up orders to mitigate risk.
- Fibonacci retracement overlays aren’t great at identifying exit points in a profiting trade, so investors will need to use other momentum and trend indicators to find suitable sell positions.
Benefits Of Using Fibonacci Retracement In Crypto
- Simple and low-risk trading strategy. Fibonacci retracements allow investors to clearly see a range of support and resistance levels that can be extremely useful in identifying low-risk entry positions. Paired with a stop-loss on the other side of the zone that’s been entered, Fibonacci retracements are a great way to prevent big losses, especially for beginners just getting their feet wet.
- Versatile. Fibonacci retracement can be used on any trending cryptocurrency – whether the momentum has lasted for months or just minutes. That means it can be great for scalpers and day traders, swing traders, and low-risk, long-term investors. That said, like most indicators and chart drawings, Fibonacci retracement is more accurate on longer-duration charts.
- Built on market psychology. Most indicators and patterns use some form of market psychology, but most are bogged down in raw numbers. While Fibonacci retracement is based on a mathematical sequence too, these numbers have much greater significance beyond trading. The “golden Fibonacci ratio” can be found all throughout nature and reflects common human sentiment – which is why the support and resistance levels tend to be so reliable (approx. 70%).
Downsides Of Using Fibonacci Retracement In Crypto
- It is not useful during sideways markets. Crypto experiences massive highs and crushing lows, but in reality, the market spends a lot of its time actually just moving sideways. In situations where the price of BTC and other coins ranges between two close points, Fibonacci retracement drawings lose a lot of their value.
- No guarantee trend will continue. A pullback on the price of Bitcoin (or other cryptos) during a bull run may turn out to be more than just a pullback, and actually a complete trend reversal. Fibonacci retracement needs to be paired with other volume and momentum indicators to ensure the trend being measured will actually continue.
- Self-fulfilling prophecy. Some experts believe that the Fibonacci retracement ratios actually provide no inkling of the market’s psychology. They argue that its popularity among traders results in them trading at that level as a form of herd mentality, rather than the numbers bearing any significance. So without the Fibonacci ratio, the pullback and support/resistance levels of crypto assets would be entirely different. However, this is just a theory and may be inaccurate.
- Not great for determining exit points. Fibonacci retracements are a good way for traders to identify entry points during a trending run, as well as find low-risk prices to set up stop-loss orders. However, Fibonacci retracements are much less useful for determining the peak of a trend, as the price action of a bullish (or bearish) asset will invariably run higher/lower than the tool’s upper zone. This is where other indicators, such as Fibonacci extensions, can be a great addition to a trader’s toolkit.
Frequently Asked Questions
What are the best Fibonacci settings for crypto?
Fibonacci levels are pre-determined based on the ratios present within the sequence. Therefore, the only settings crypto traders need to worry about is which of these ratios they wish to use. Crypto traders may only use a few key levels (38.2%, 50%, 61.8%, and 100%) due to the more volatile nature of the market.
What is the best time frame for Fibonacci retracement crypto?
Fibonacci retracement can be effective for any timeframe. It can be used in an extremely short timeframe (5 minutes) or a long one (3 months). This is part of what makes the tool so versatile and popular. With that said, like most indicators, Fibonacci retracement support and resistance levels are more reliable when following a longer-term trend.
Kevin Groves
Kevin started in the cryptocurrency space in 2016 and began investing in Bitcoin before exclusively trading digital currencies on various brokers, exchanges and trading platforms. He started Hedge With Crypto to publish informative guides about Bitcoin and share his experiences with using a variety of crypto exchanges around the world.